
Availability
LinkedIn Ads is a B2B advertising platform that enables businesses to reach professionals based on job title, industry, seniority, and company size — making it a key channel for demand generation and lead capture. Connecting LinkedIn Ads to Databox brings your campaign performance data into a single reporting environment alongside your other marketing channels. You can track spend efficiency, monitor impressions, clicks, and conversions, and build dashboards that surface the insights needed to optimize your B2B advertising strategy.
If your credentials don't include full access to the data source, make sure your access level meets any permission requirements listed in the Specification section of the integration's page in the Metric Library.
To connect LinkedIn Ads to your Databox account for the first time, log in using your LinkedIn credentials.
If you've already established a connection, you can reuse it to add new accounts, as long as those accounts are accessible with the existing connection's credentials.
When you approve the Databox app, you authorize a secure connection to your LinkedIn Ads account. This allows Databox to access only the reporting data needed to track and visualize your ad performance. No changes are made to your campaigns, and you can revoke access at any time from your LinkedIn settings.
Choose the LinkedIn Ads account you want to report on. If you manage multiple LinkedIn Ads accounts, you'll be prompted to select the specific account you want to connect to Databox.
The LinkedIn Ads integration allows you to create custom metrics using the metric builder, ideal for visualizing data not included in the basic metrics offered by the integration.
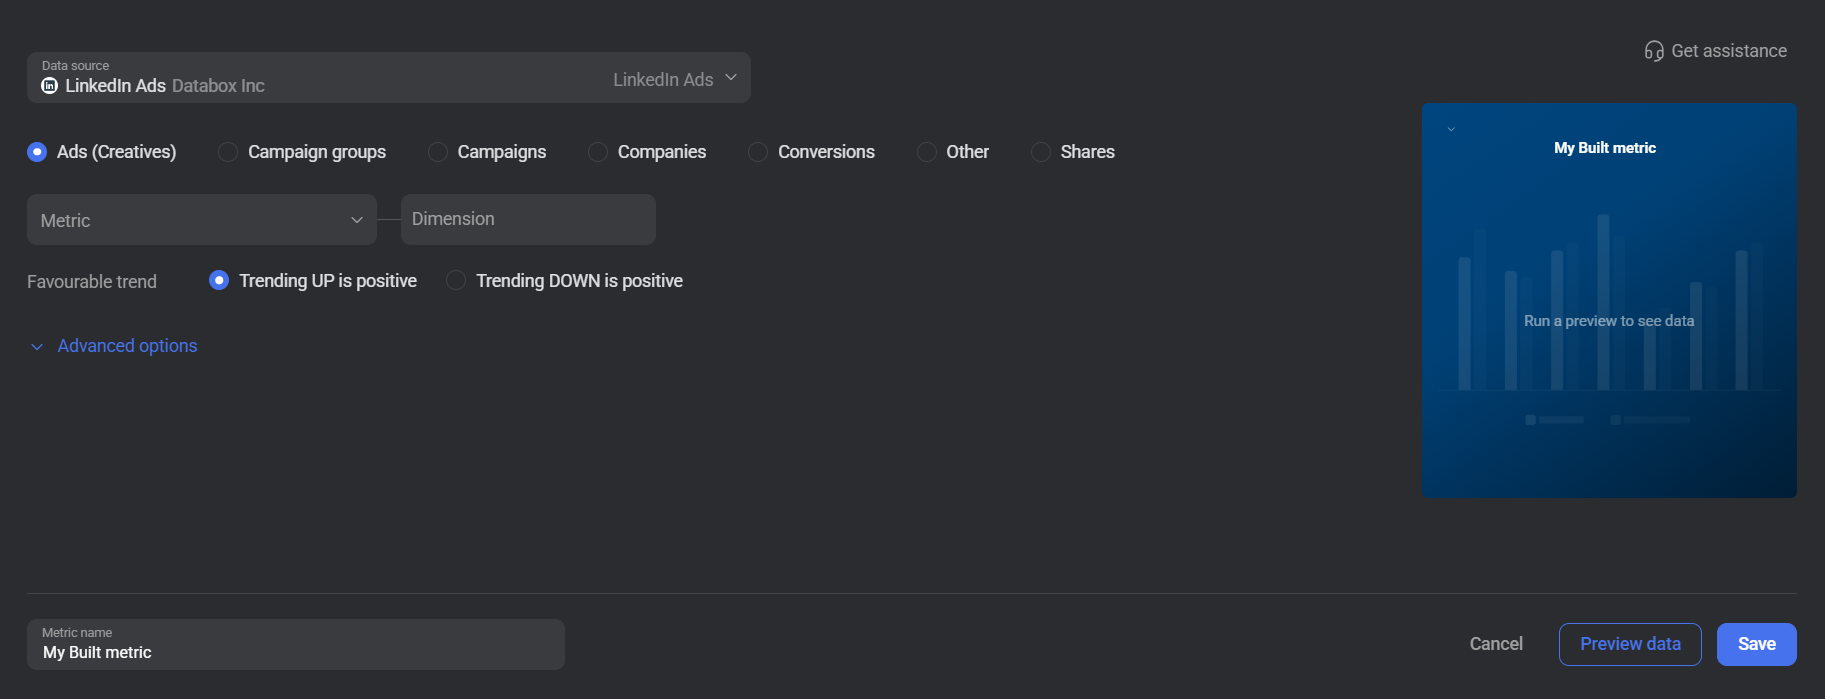
To create a custom metric, start by selecting a metric from the Metric selector. Next, customize your metric by optionally adding a dimension and applying one or more filters. The available options depend on the selected tab and data type.
The LinkedIn Ads metric builder is organized into seven tabs, each corresponding to a different dimension or reporting scope.
Analyze performance broken down by individual ad creative. Use this tab to compare how specific creatives perform across impressions, clicks, engagement, and conversions, and identify which creative elements resonate most with your target audience.
 In LinkedIn Ads: Go to the Campaign Manager section.
Analyze performance at the campaign group level to understand how budget and delivery are distributed across your top-level organizational units. This tab is useful for evaluating overall group-level efficiency before diving into individual campaigns.
In LinkedIn Ads: Go to the Campaign Manager section.
Track metrics per campaign to evaluate how each individual campaign contributes to your overall advertising goals. Use this tab to compare spend, reach, and conversion performance across campaigns and make data-driven budget decisions.
In LinkedIn Ads: Go to the Campaign Manager section.
See how performance varies by company to understand which organizations are engaging with your ads. This tab is particularly useful for account-based marketing strategies, allowing you to assess reach and engagement at the company level.
In LinkedIn Ads: Go to the Campaign Manager section.
Track conversion events recorded by LinkedIn. Only the Conversions metric is available in this tab, making it a focused view for monitoring how effectively your campaigns are driving defined conversion actions.
In LinkedIn Ads: Go to the Campaign Manager section.
Access aggregate metrics with no dimension breakdown applied. Metrics in this tab reflect totals across all entities, providing a high-level view of overall account performance without segmentation.
Measure organic and viral performance on shared content. Use this tab to track how shared posts are performing in terms of reach, engagement, and viral amplification beyond your paid audience.
In LinkedIn Ads: Go to the Campaign Manager section.

The LinkedIn Ads integration supports the creation of datasets, which allow you to structure and format your LinkedIn Ads data for more flexible reporting in Databox. By organizing your data into a tabular format, datasets make it easier to filter, segment, and visualize key metrics across projects, clients, and team members.
The entity relationship diagram (ERD) below illustrates how data is organized within the LinkedIn Ads integration, displaying the available views and columns, as well as the relationships between them (primary and foreign keys). This diagram represents the schema, or structure, of the data and helps you understand the underlying data model. With this context, you can create datasets using the relevant views and columns to build custom metrics tailored to your reporting needs.
For comprehensive details on metrics, data availability, templates, specifications, usage guidelines, and other key information, refer to the resources listed below.


FAQ
Why are certain entities or properties unavailable in the metric builder?
The metric builder pulls raw and analytics data from LinkedIn Ads' APIs. If an entity or property is missing, it is likely due to limited API support or technical implementation restrictions. If there's something you'd like to see included, feel free to submit a request, so we can consider it for future updates to the integration.


