
Availability
LinkedIn Company Pages give businesses, organizations, and brands a dedicated presence on LinkedIn to publish updates, showcase products and services, recruit talent, and build an audience of professionals. As one of the few social platforms built around professional context, LinkedIn is often where B2B brands see their most engaged organic audience — making it important to track not just reach, but the quality of that engagement over time. Connecting LinkedIn Company Pages to Databox brings your page analytics into a shared reporting workspace, so you can monitor organic performance, identify which content resonates with your audience, compare trends across time periods, and report on your LinkedIn presence alongside the rest of your marketing data.
If your credentials don't include full access to the data source, make sure your access level meets any permission requirements listed in the Specification section of the integration's page in the Metric Library.
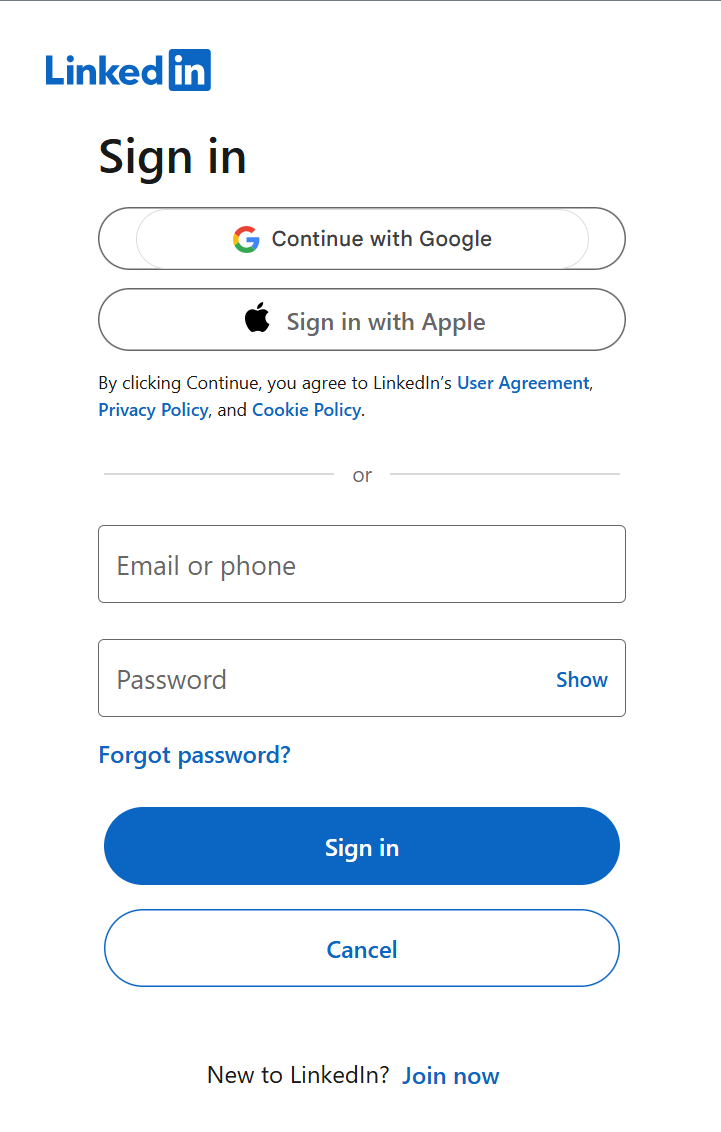
To connect LinkedIn Company Pages to your Databox account for the first time, sign in using your LinkedIn credentials. You can enter your Email and Password directly, or continue with Google or Apple.
If you've already established a connection, you can reuse it to add new accounts, as long as those accounts are accessible with the existing connection's credentials.
If you manage multiple LinkedIn company pages, you'll be prompted to select the specific page you want to connect to Databox. If you have only one page, it will be selected automatically.

The LinkedIn Company Pages integration supports the creation of datasets, which allow you to structure and format your LinkedIn Company Pages data for more flexible reporting in Databox. By organizing your data into a tabular format, datasets make it easier to filter, segment, and visualize key metrics across projects, clients, and team members.
The entity relationship diagram (ERD) below illustrates how data is organized within the LinkedIn Company Pages integration, displaying the available views and columns, as well as the relationships between them (primary and foreign keys). This diagram represents the schema, or structure, of the data and helps you understand the underlying data model. With this context, you can create datasets using the relevant views and columns to build custom metrics tailored to your reporting needs.
For comprehensive details on metrics, data availability, templates, specifications, usage guidelines, and other key information, refer to the resources listed below.


FAQ
Can I connect a personal LinkedIn profile?
Yes, but as a separate integration. This article covers LinkedIn Company Pages, which tracks page-level analytics. To track personal profile metrics such as profile views, follower growth, and post engagement, use the LinkedIn Personal integration instead.
Why does my LinkedIn Company Pages connection disconnect every 365 days?
LinkedIn uses access tokens that expire after 365 days. When a token expires, the data source disconnects automatically. To reconnect, go to Data Manager and click Reconnect next to your LinkedIn Company Pages data source. This is a LinkedIn platform limitation and applies to all third-party tools using the LinkedIn API.


