
Availability
HubSpot CRM is a cloud-based customer relationship management platform that helps sales teams manage contacts, track deals through their pipeline, and log engagement activities in a single place. It provides built-in reporting on deals, companies, and sales activity, giving teams visibility into pipeline health, rep performance, and revenue trends. Connecting HubSpot CRM to Databox lets you bring that data into your dashboards and reports alongside your other business tools, and build custom metrics using company properties, deal stages, and engagement types that aren't available out of the box.
If your credentials don't include full access to the data source, make sure your access level meets any permission requirements listed in the Specification section of the integration's page in the Metric Library.
To connect HubSpot CRM to your Databox account for the first time, log in using your HubSpot credentials.
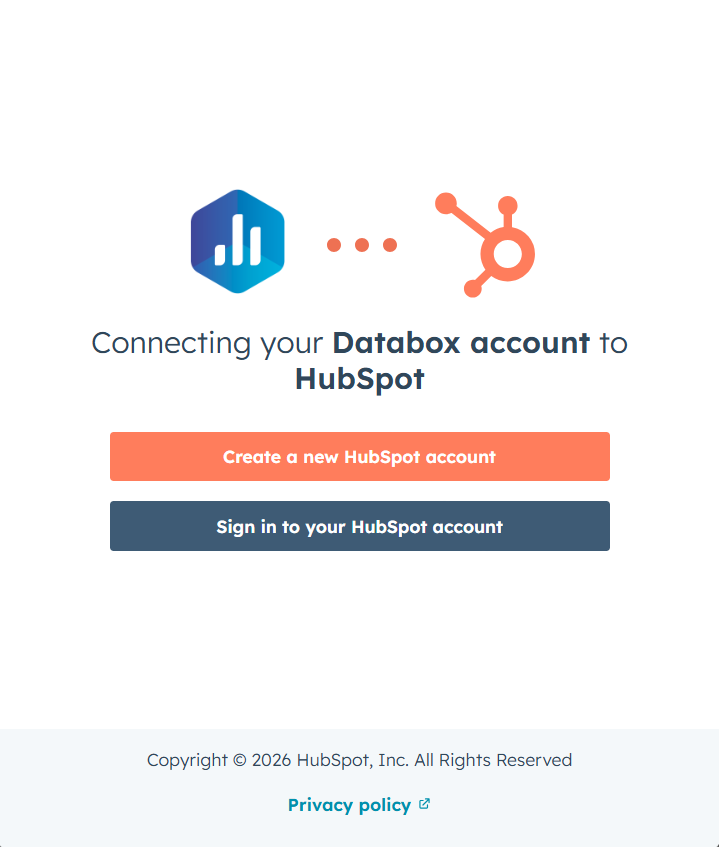
Select the HubSpot account you want to connect to Databox.
HubSpot will display the list of permissions Databox needs to access your data. Review these carefully, then accept the terms to proceed.
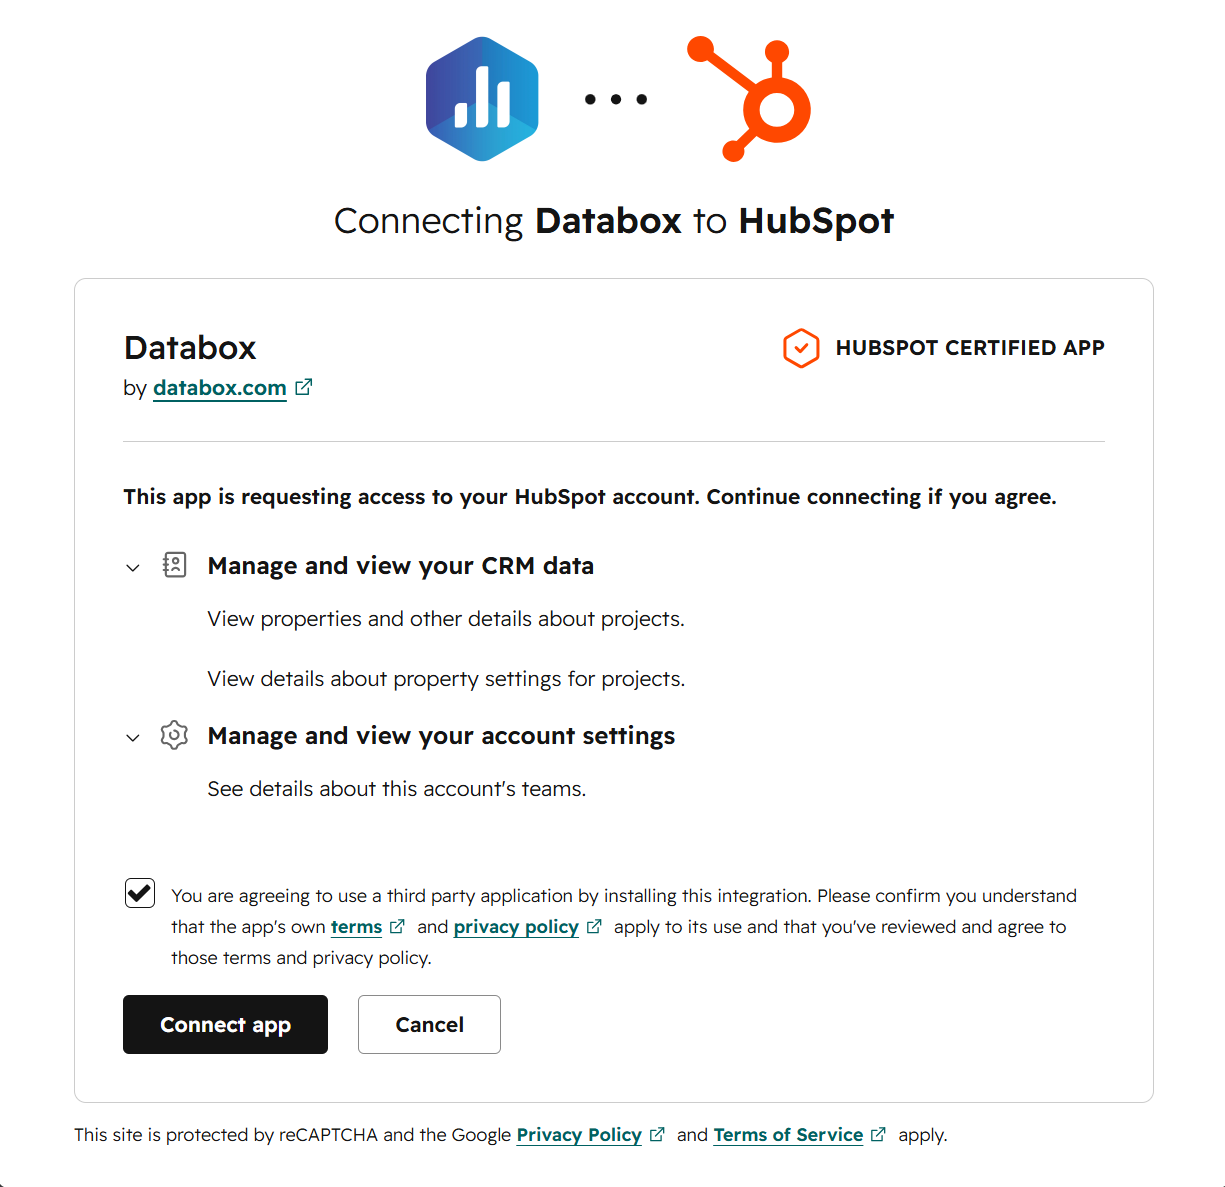
Click Connect app to grant Databox access to your HubSpot account and complete the connection.
To remove the HubSpot CRM integration, you can either uninstall the Databox app from your HubSpot account or delete the connection from within Databox. These two actions have different effects on your data, so it's worth understanding the distinction before proceeding.
Uninstall from HubSpot removes Databox's access at the source. Follow the steps in HubSpot's documentation to uninstall the app from your HubSpot account. This stops Databox from syncing any new data from HubSpot, but all data already synced to your Databox account remains intact.
Delete the connection or data source in Databox removes the integration from the Databox side. Follow the steps to delete the connection or delete the data source from within Databox — either action will remove both. This stops future syncs and permanently purges all HubSpot CRM data already synced to your account.
The HubSpot CRM integration allows you to create custom metrics using the metric builder, ideal for visualizing data not included in the basic metrics offered by the integration.
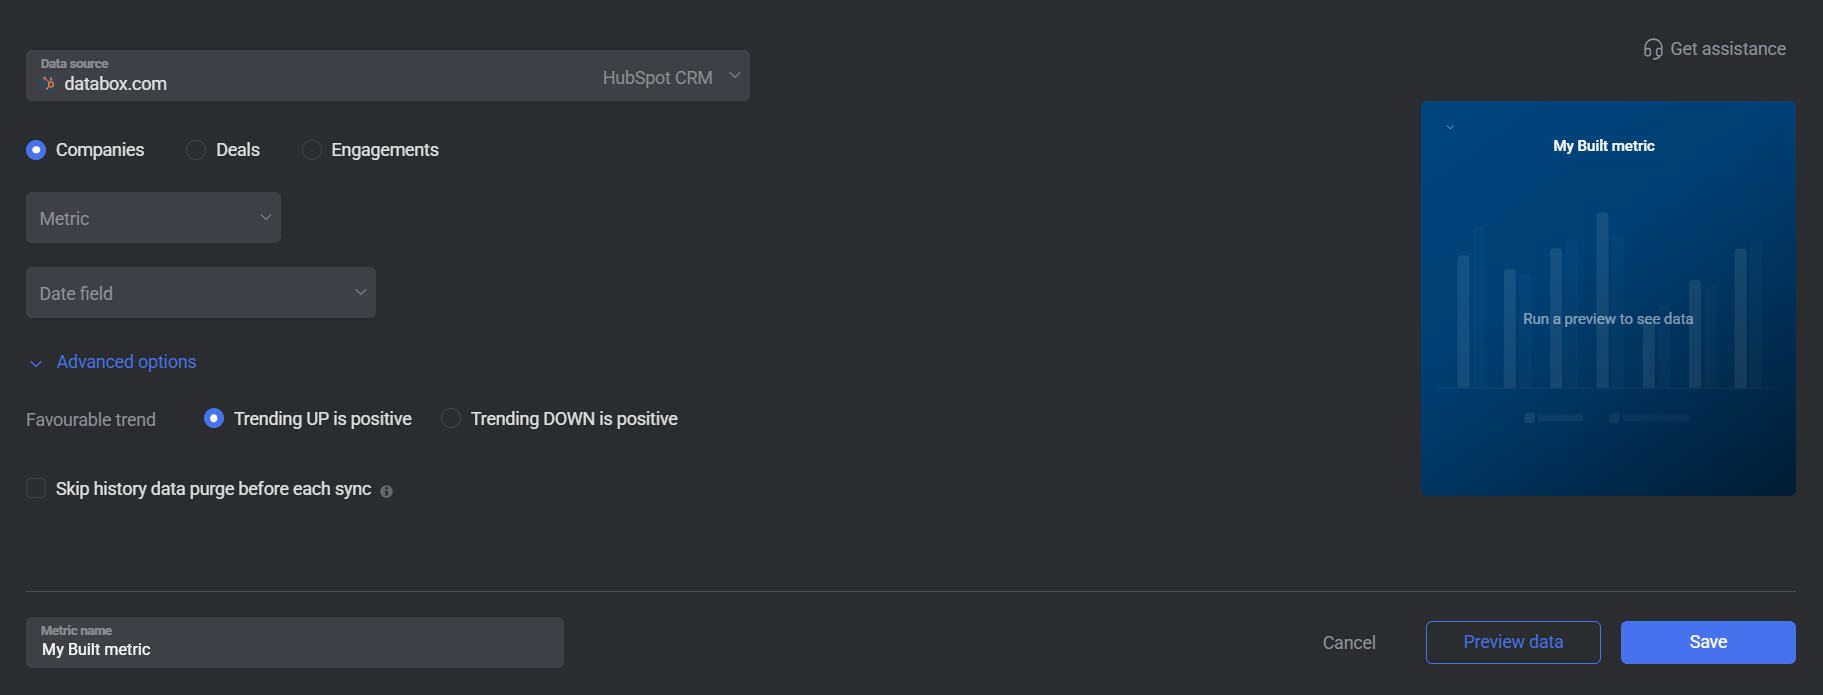
To create a custom metric, start by selecting a metric from the Metric selector. Next, customize your metric by optionally adding a dimension and applying one or more filters. The available options depend on the selected entity and data type (e.g., number, text, etc.).
The entities accessible for metric creation are listed below.
Companies represent the business accounts stored in your HubSpot CRM, including any custom company properties your team has defined. You can use the Companies entity to count companies by a specific property value, measure total revenue by region or tier, or track how company attributes change over a selected date range. Custom Company Properties that are not available in the basic HubSpot CRM metrics can be accessed here.
 In HubSpot CRM: Go to the CRM > Companies section.
Deals track sales opportunities as they move through your pipeline stages, from creation to closed won or closed lost. Use the Deals entity to build metrics around deal counts, amounts, owners, pipelines, and stages — including custom deal properties that are not surfaced in the standard metric set. Popular use cases include tracking individual sales rep performance, filtering by pipeline, and reporting on deal stage progression.
In HubSpot CRM: Go to the CRM > Deals section.
Engagements represent logged sales activities in HubSpot CRM. When selecting the Engagements entity, you first choose an Engagement type from the following options: Calls, Emails, Meetings, Notes, or Tasks. The available metrics and filters then reflect the selected engagement type. This entity is useful for tracking sales activity volume, rep engagement patterns, call outcomes, and task completion rates over time.
In HubSpot CRM: Go to the CRM section and open the relevant engagement type (Meetings, Notes, Calls, etc.).

The HubSpot CRM integration supports the creation of datasets, which allow you to structure and format your HubSpot CRM data for more flexible reporting in Databox. By organizing your data into a tabular format, datasets make it easier to filter, segment, and visualize key metrics across projects, clients, and team members.
The entity relationship diagram (ERD) below illustrates how data is organized within the HubSpot CRM integration, displaying the available views and columns, as well as the relationships between them (primary and foreign keys). This diagram represents the schema, or structure, of the data and helps you understand the underlying data model. With this context, you can create datasets using the relevant views and columns to build custom metrics tailored to your reporting needs.
For comprehensive details on metrics, data availability, templates, specifications, usage guidelines, and other key information, refer to the resources listed below.


FAQ
What is the difference between the HubSpot CRM, HubSpot Marketing, HubSpot Service, and HubSpot Custom Objects integrations in Databox?
Each HubSpot integration in Databox pulls data from a different part of the platform:
- HubSpot CRM — deals, companies, and sales engagement activities such as calls, meetings, notes, emails, and tasks.
- HubSpot Marketing — email campaigns, blog post and landing page performance, contact lifecycle stages, and automation workflows.
- HubSpot Service — tickets, ticket pipelines, and service workflows.
- HubSpot Custom Objects — user-defined record types your team has created in HubSpot Enterprise, such as Shipments, Vehicles, or Memberships, that don't fit the standard object structure.
You can connect all four integrations to the same Databox account to get a unified view across your entire HubSpot data model.
Why are certain entities or properties unavailable in the metric builder?
The metric builder pulls raw and analytics data from HubSpot's APIs. If an entity or property is missing, it is likely due to limited API support or technical implementation restrictions. If there's something you'd like to see included, feel free to submit a request, so we can consider it for future updates to the integration.


