
Google BigQuery is a fully managed, serverless data warehouse built to analyze large volumes of structured and semi-structured data at scale. It eliminates infrastructure management by automatically handling storage, performance, and scaling, allowing teams to focus on querying and insights instead of maintenance. BigQuery supports GoogleSQL, real-time analytics, and native integrations across the Google Cloud ecosystem. It is commonly used for centralized data analysis, event tracking, product analytics, and powering business intelligence tools with fast, reliable reporting.
To allow Databox to securely access your BigQuery data, create a dedicated service account in Google Cloud.
- Go to IAM & Admin > Service Accounts.
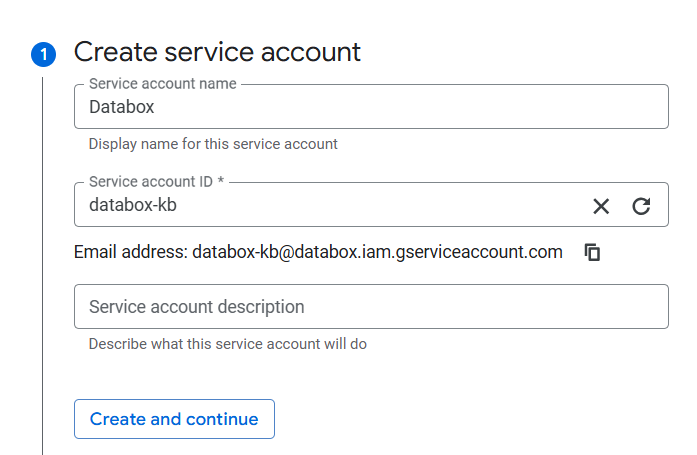
- Click + Create Service Account.
- Enter a Service account name (e.g., “Databox Integration”).
- Review the auto-generated Service account ID. You can edit it if needed.
- Click Create and continue.

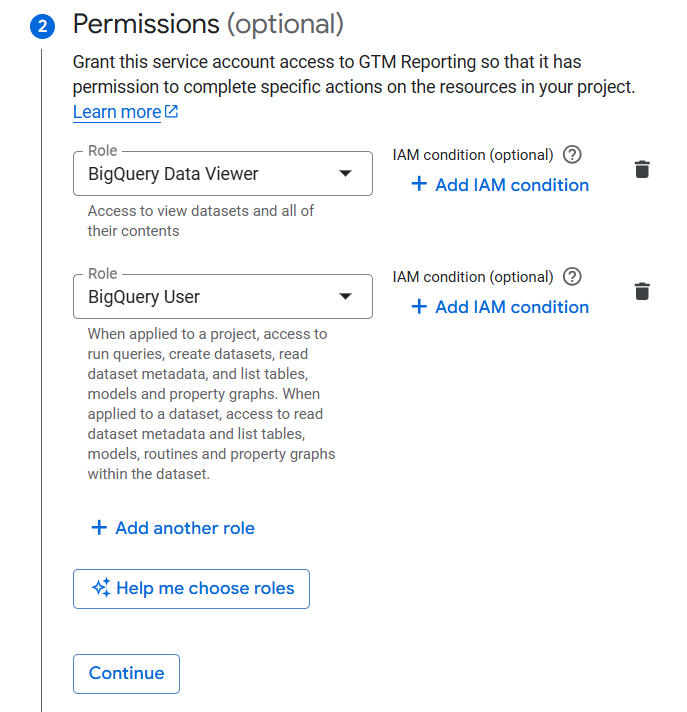
Assign the necessary roles so the service account can read data and run queries in BigQuery.
- Grant the BigQuery Data Viewer and BigQuery User roles to the new service account.
- Click Continue.
- Grant access to users or groups that need to perform actions as the service account (optional).
- Click Done.
Create a JSON key file that Databox will use to authenticate the connection.
- In the Service accounts page, click the service account you just created.
- Go to the Keys tab.
- Click Add key and select Create new key.
- Choose JSON as the key type.
- Click Create to download the JSON file
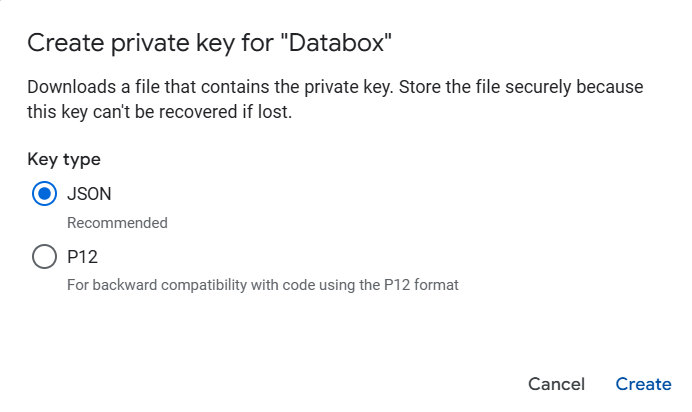
Store this file securely. You will need its contents in the next step.
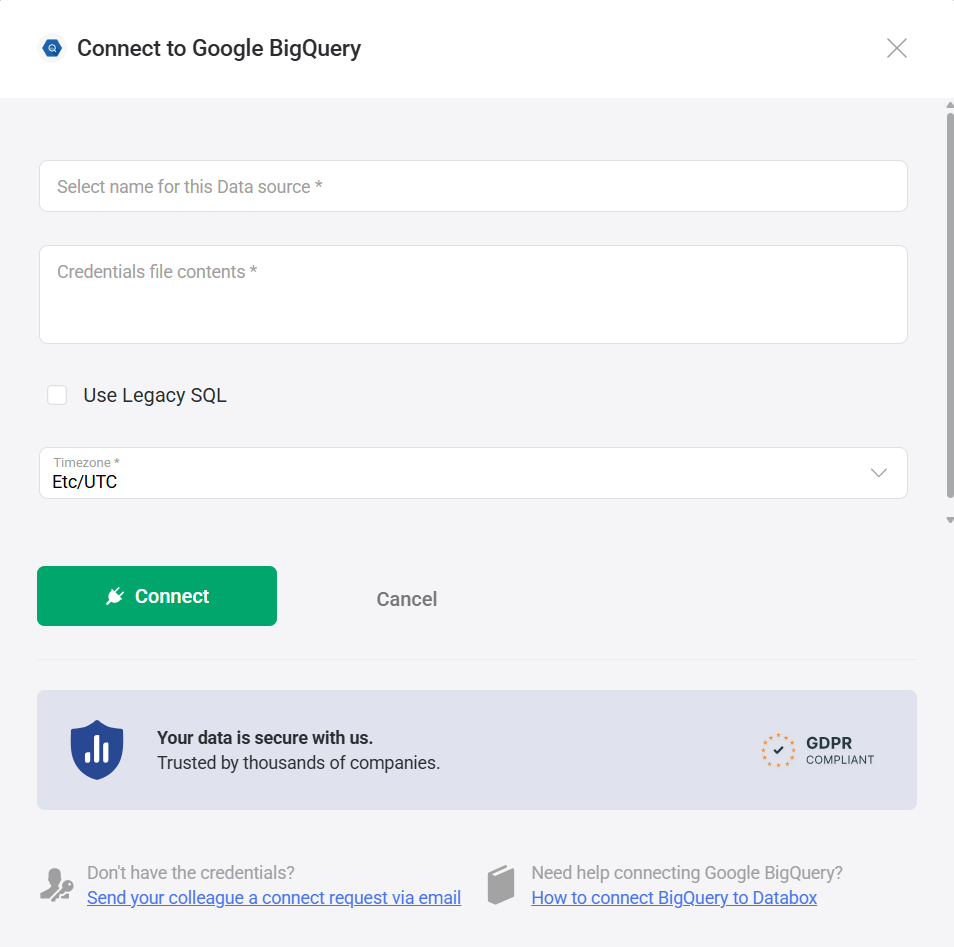
Next, add the BigQuery connection in Databox using the credentials you generated.
- Name of the data source (required) — A label used to identify the BigQuery connection in Databox.
- Credential file contents (required) — The full contents of the JSON key file generated in Step 3.
- SQL Mode — GoogleSQL is used by default**.** Select the Use Legacy SQL checkbox only if your queries require Legacy SQL syntax.
- Time zone (required) — The time zone used for interpreting and filtering data points in visualizations.
The Google BigQuery integration supports the creation of datasets, which allow you to define and shape the specific data you want to use for reporting in Databox. Datasets make it easier to focus on the most relevant information, enabling you to filter, visualize, and analyze metrics across projects, teams, and clients without writing complex queries each time.
- Select a dataset: Choose the BigQuery dataset that contains the data you want to work with.
- Select a table: Pick the appropriate table within that dataset.
- Select columns: Browse and select the specific columns (fields) from your tables or views to include in your dataset. These columns define the structure and content of your dataset.
If your BigQuery data is stored outside the default US region (for example, in the EU region), the dataset list may not populate in the dataset builder. This happens because Databox currently retrieves schema metadata from the US region by default.
As a workaround, you can create your dataset using a custom query instead of selecting a dataset and table from the list. When querying your tables or views, include the appropriate region qualifier in the project reference.
For example:
SELECT catalog_name, schema_name
FROM `<project>.region-<region>.INFORMATION_SCHEMA.SCHEMATA`
ORDER BY schema_name
Replace <project> with your Google Cloud project ID and <region> with the region where your dataset is hosted (for example, eu).
For more advanced use cases, you can write a custom SQL query instead of selecting columns manually. This allows you to:
- Join multiple tables
- Apply filters and aggregations
- Format or transform data before importing it into Databox
Your query must return a valid tabular result to be used as a dataset.
- BigQuery GoogleSQL Query Syntax — Learn how to write queries using GoogleSQL, including SELECT statements, joins, filtering, grouping, and date functions.
- BigQuery Legacy SQL Syntax, Functions and Operators — Reference guide for working with older query formats and understanding available operators and built-in functions.
For comprehensive details on metrics, data availability, templates, specifications, usage guidelines, and other key information, refer to the resources listed below.


FAQ
What's new with the Google BigQuery integration in 2025?
In 2025, we introduced dataset support for Google BigQuery. You can now import raw data from your Google BigQuery account into a reusable dataset and build multiple metrics from it using the metric builder— no need to write separate queries for each metric.
This update also removes per-query size limits. Instead, your data usage is governed by Databox's global dataset size limits, giving you more flexibility when working with larger datasets.


