
Availability
Facebook Ads is a digital advertising platform that enables businesses to reach highly targeted audiences based on interests, demographics, and online behavior. It allows advertisers to control costs while maximizing reach and engagement. The platform provides detailed performance insights, making it easy to track results and adjust campaigns for better outcomes. With its advanced targeting and analytics tools, Facebook Ads helps businesses drive traffic, generate leads, and boost conversions effectively.
If your credentials don't include full access to the data source, make sure your access level meets any permission requirements listed in the Specification section of the integration's page in the Metric Library.
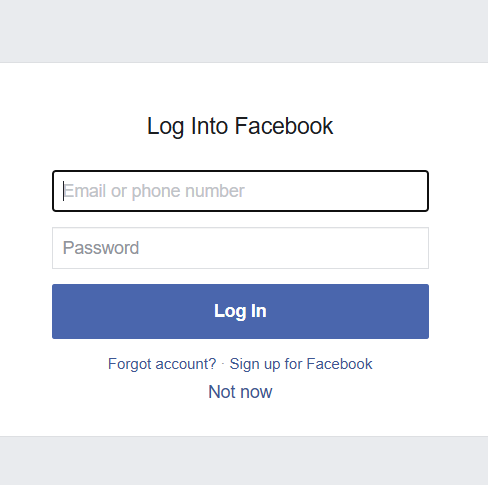
To connect Facebook Ads to your Databox account for the first time, log in using your Facebook credentials.
If you've already established a connection, you can reuse it to add new accounts, as long as those accounts are accessible with the existing connection's credentials.
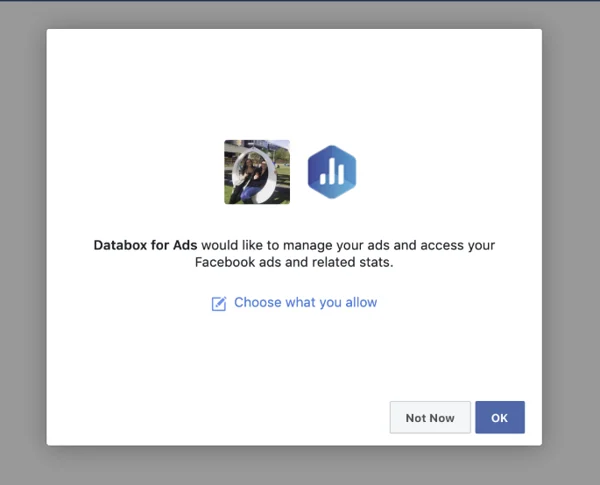
When you approve the Databox app, you authorize a secure connection to your Facebook Ads account. This allows Databox to access only the reporting data needed to track and visualize your ad performance. No changes are made to your campaigns, and you can revoke access at any time from your Facebook settings.
Choose the ad account you want to report on. If you manage multiple Facebook Ads accounts, you'll be prompted to select the specific account you want to connect to Databox.
The Facebook Ads integration allows you to create custom metrics using the metric builder, ideal for visualizing data not included in the basic metrics offered by the integration.
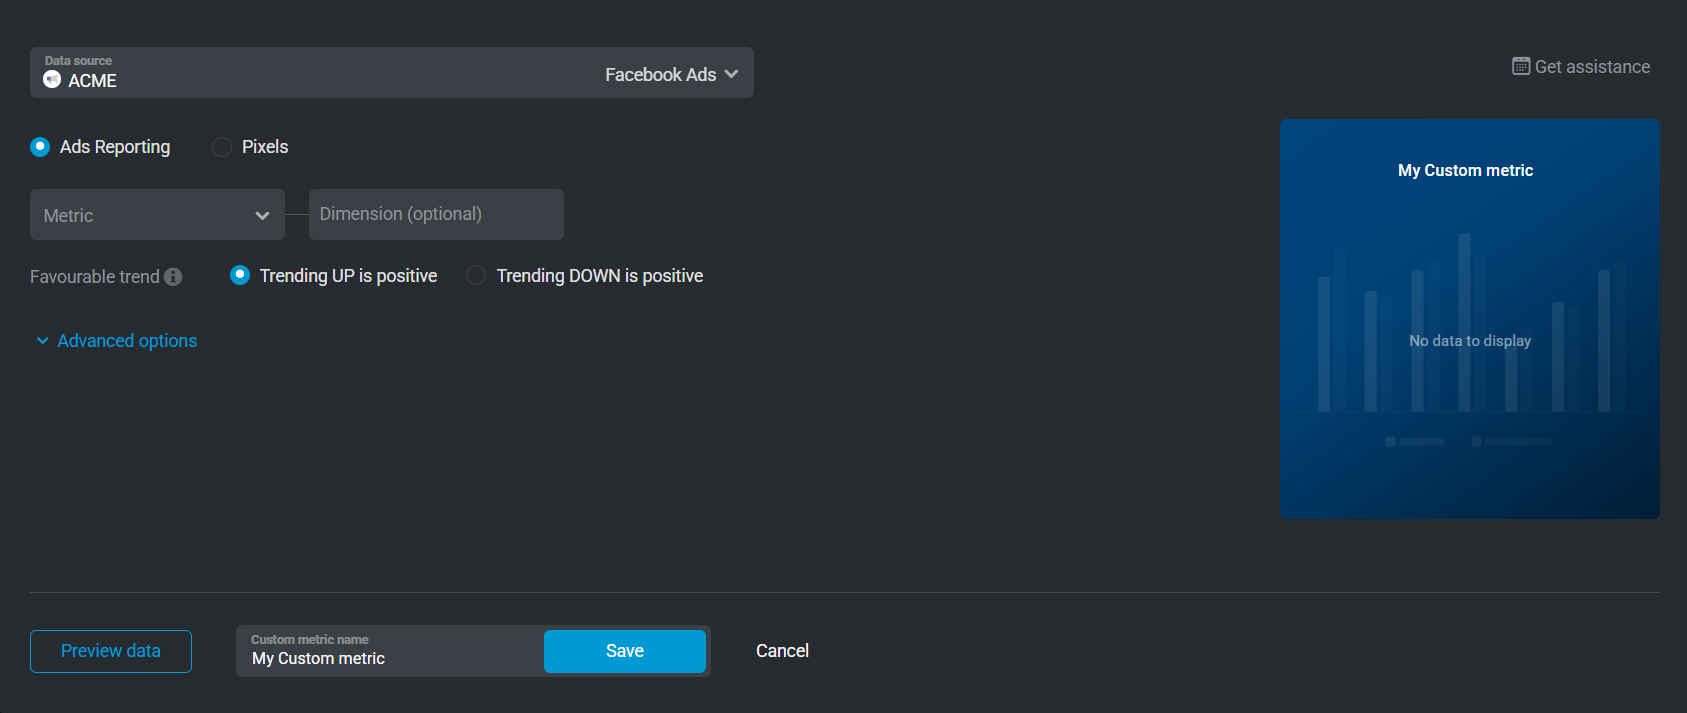
To create a custom metric, start by selecting a metric from the "Metric" selector. Next, customize your metric by optionally adding a dimension and applying one or more filters.
There are two entities available for custom metric creation: Ads Reporting and Pixels.
Access standard performance metrics such as Impressions, Clicks, CTR, CPA, ROAS, and more. These metrics can be broken down by dimensions like age, device, and placement, or viewed at the campaign, ad set, or ad level.
You'll also find results-related metrics and conversion tracking. Metrics like Actions and Cost per Action Type will prompt you to select a specific action type (e.g., purchase, lead, add to cart) when creating the metric.
 In Facebook Ads: Go to the Ads Manager section.
Provides data related to your Facebook Pixel, including events received and any custom conversions you've configured.
In Facebook Ads: Go to the Events Manager section.

The Facebook Ads integration supports the creation of datasets, which allow you to structure and format your Facebook Ads data for more flexible reporting in Databox. By organizing your data into a tabular format, datasets make it easier to filter, segment, and visualize key metrics across projects, clients, and team members.
The entity relationship diagram (ERD) below illustrates how data is organized within the Facebook Ads integration, displaying the available views and columns, as well as the relationships between them (primary and foreign keys). This diagram represents the schema, or structure, of the data and helps you understand the underlying data model. With this context, you can create datasets using the relevant views and columns to build custom metrics tailored to your reporting needs.
For comprehensive details on metrics, data availability, templates, specifications, usage guidelines, and other key information, refer to the resources listed below.


FAQ
Why do I need to reconnect my Facebook Ads data sources regularly?
Facebook Ads API uses short-lived access tokens for security. These tokens expire after 60 days or can be revoked if you change your password, update permissions, or if Meta performs a security check. When this happens, you'll need to reauthenticate to restore access.


