
Availability
Checking your key metrics usually means opening a Databoard and navigating to the right data. Personalizing the home page puts the most important numbers in front of you the moment you log in: add metrics to the performance overview and Databox generates an AI-powered summary of recent trends, surfaces anomalies, and gives you the option to enable Smart Alerts for those metrics — all before you've clicked anything else.
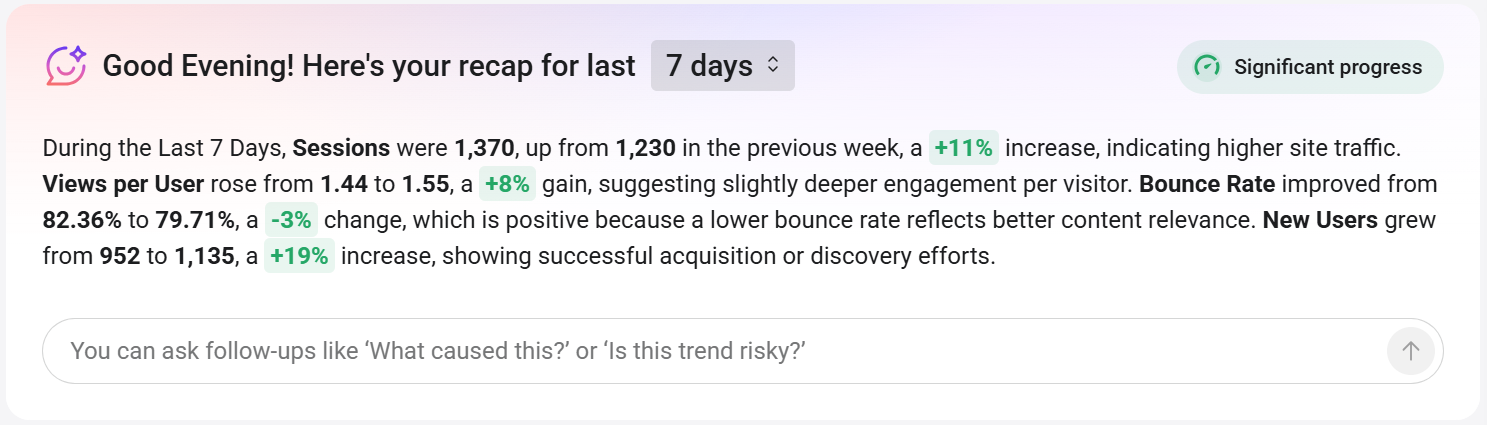
The AI performance summary at the top of the page generates a narrative analysis of the metrics in your performance overview for the selected period. It highlights changes in value, and provides context for what the numbers may indicate. A status badge — for example, Significant progress — gives you an instant read on overall performance.
Use the date range selector next to the greeting (for example, 7 days) to adjust the period the summary covers.
The input field below the narrative connects to Genie, the Databox AI assistant. Enter a follow-up question — such as "What caused this?" or "Is this trend risky?" — to continue the analysis.
The performance overview section displays your key metrics as cards in two rows. Each card shows the metric name, current value and line graph, and the percentage change compared to the previous period. Use the left and right arrows to scroll through additional metrics. Click any card to open a drawer with deeper metric insights — see Explore metric insights for details.
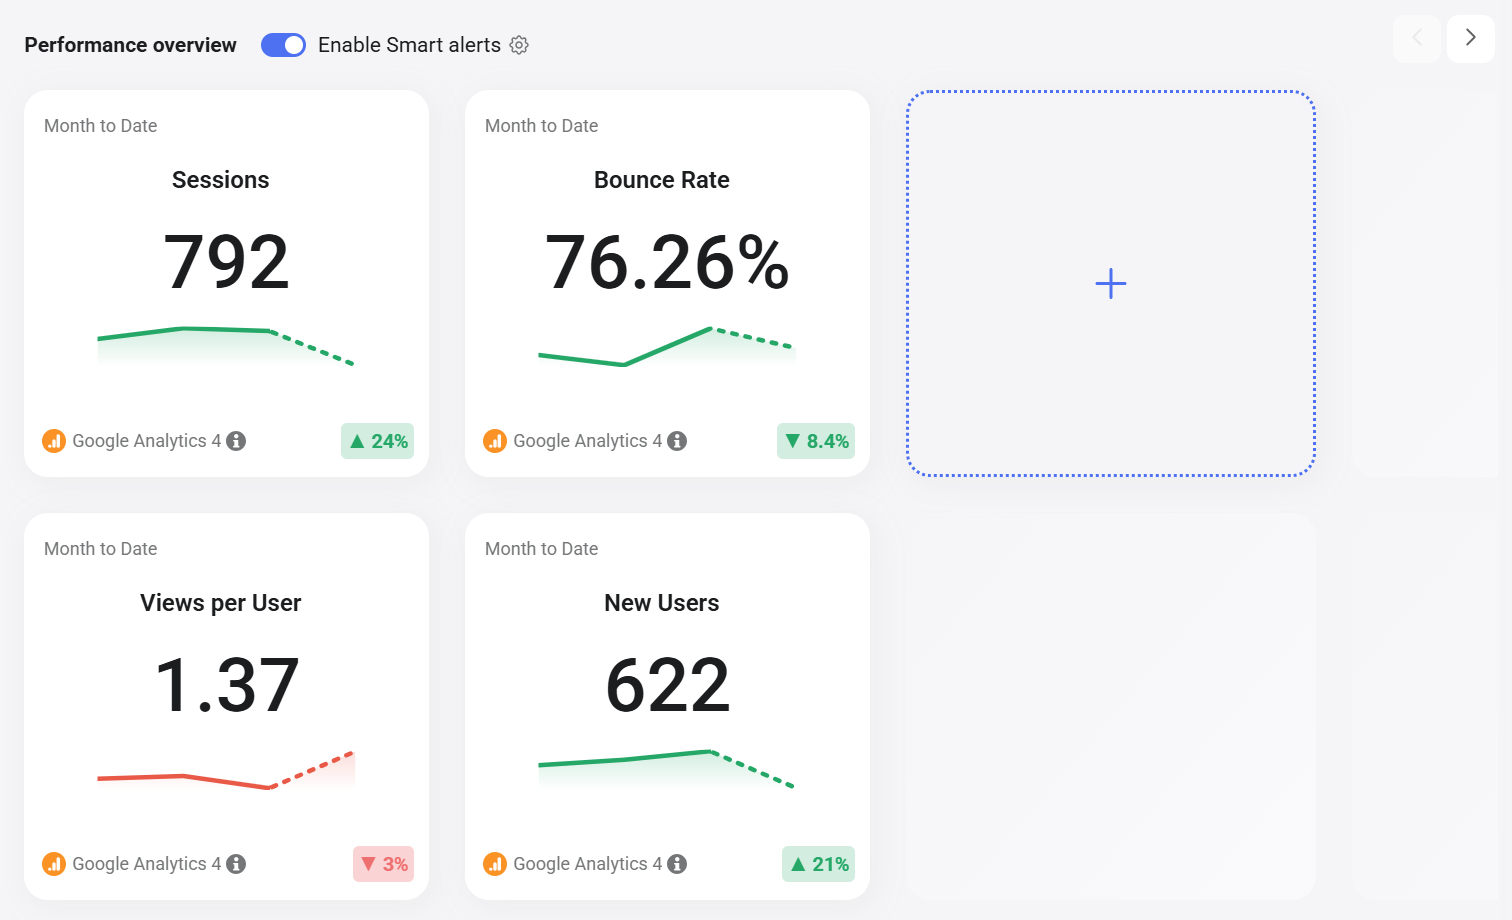
- In the Performance overview section, click the + box.
- Select an option:
- Add Metric — search for or select the metric you want to track.
- Add goal — search for or select the goal you want to track.
- Hover over the card.
- Click ... in the top-right corner of the card.
- Select an option:
- Change Metric / Change Goal — replace the current metric or goal with a different one.
- Remove from Home — remove the card from the performance overview.

Smart Alerts monitor each metric in the performance overview for anomalous behavior and send a notification when something changes significantly. Toggle Enable Smart alerts in the performance overview header to turn this on or off for all metrics in the section. Click the gear icon ( ) next to the toggle to configure alert settings.
For details on how Smart Alerts work and how to configure them, see Set up a metric notification.
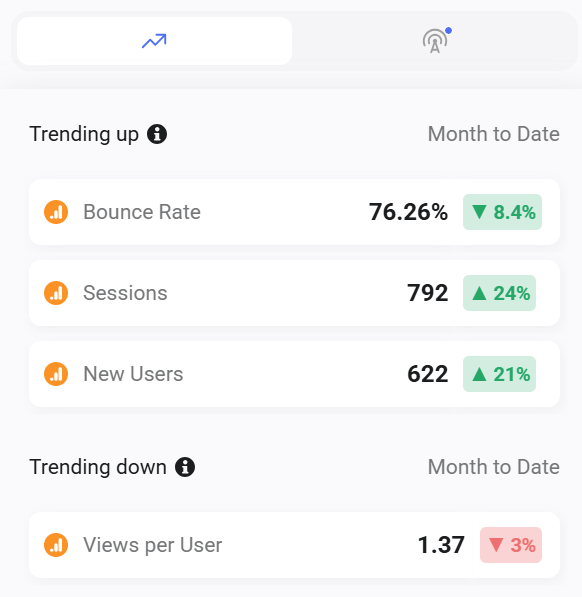
The panel on the right side of the home page has two tabs. The trending tab ( ) shows which of your favorite metrics are Trending up and Trending down for the current period.
These include metrics from your performance overview and any metrics on your My Metrics page.
The product updates tab ( ) shows the latest Databox announcements and feature releases. Each entry includes a category tag, a short description, and a Read more link to the full announcement. This is a quick way to stay informed about new features and improvements without leaving the app.
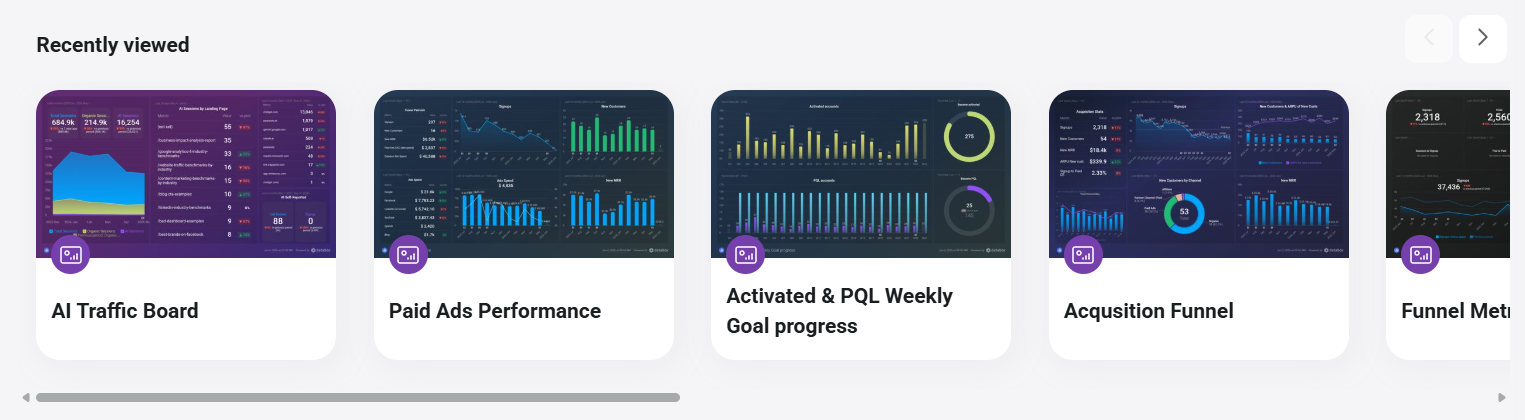
The Recently viewed section displays thumbnails of the Databoards and reports you've opened most recently. Use the left and right arrows to scroll through the row and quickly return to any Databoard or report.
FAQ
Can I reorder the metrics in the performance overview?
Yes. Hover over a card to reveal the drag handle at the top, then drag the card to the position you want.


