
Drift is a conversational marketing and sales platform that helps businesses engage website visitors in real time through AI-powered chatbots, live chat, and automated playbooks. It enables go-to-market teams to qualify leads, book meetings, and accelerate pipeline by delivering personalized experiences at scale. Connecting Drift to Databox lets you monitor key metrics like new conversations, response times, and playbook performance alongside data from your other tools, giving you a complete picture of how your pipeline is progressing.
If your credentials don't include full access to the data source, make sure your access level meets any permission requirements listed in the Specification section of the integration's page in the Metric Library.
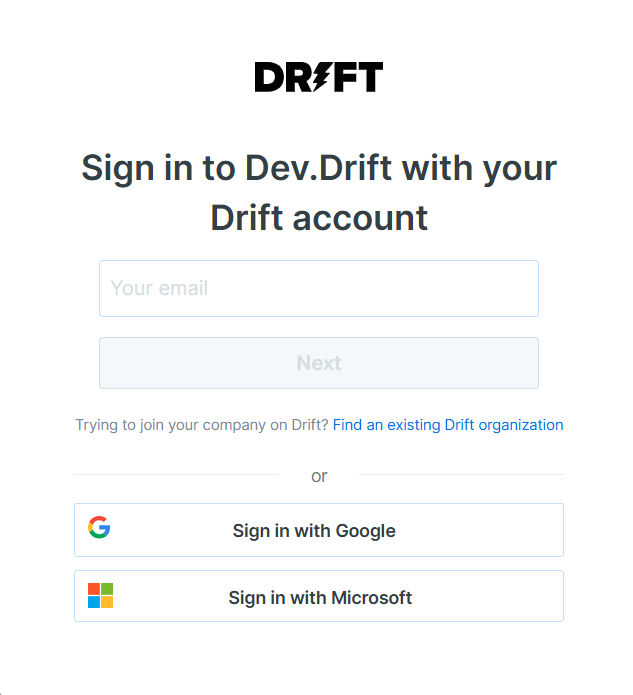
To connect Drift to your Databox account for the first time, sign in using your email address, or use Sign in with Google or Sign in with Microsoft.
If you've already established a connection, you can reuse it to add new accounts, as long as those accounts are accessible with the existing connection's credentials.
After signing in, select a Drift user from the list to complete the connection. Bot users are excluded from this list.
For comprehensive details on metrics, data availability, templates, specifications, usage guidelines, and other key information, refer to the resources listed below.


FAQ
Why can't I find a Drift metric I was previously using?
Some metrics that previously appeared by name (e.g. "Sent by Email Playbook") are now available as dimensions within a new placeholder metric (e.g. "By Email Metrics"). Select the new metric and then apply the corresponding dimension using the Breakdown by selector to find your data.


