
In this document, we will walk through how to add data from multiple Data Sources to one Databox report.
You can add data from multiple Data Sources to a Databoard using the Metric Library or the list of blank Visualization Types in the Datablock Library of the Designer. Learn more about the Datablock Library here.

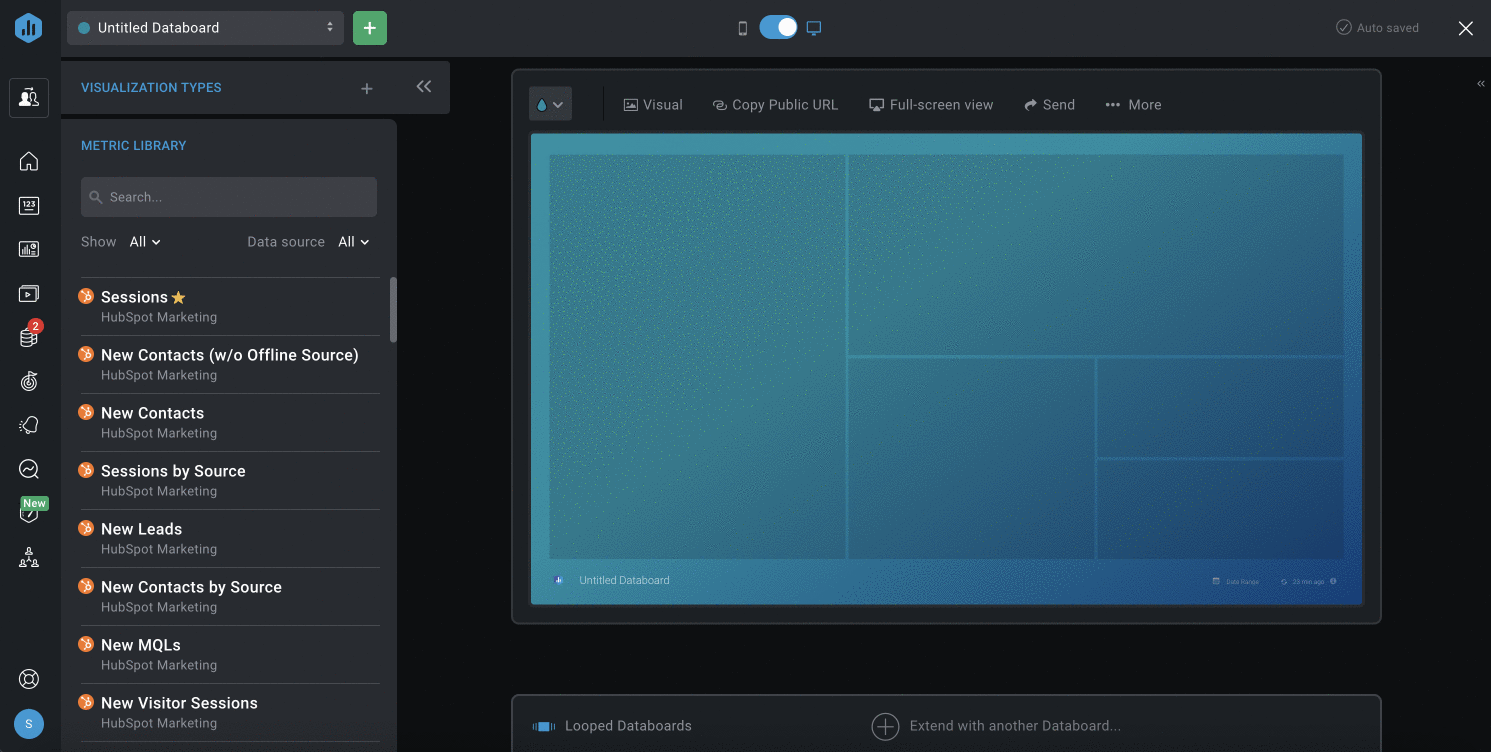
- Navigate to the Datablock Library on the left-hand side of the Designer to find the Metric Library section.
- Choose the Data Source you want to add to the Databoard from the Data Source drop-down list.
- Search for a pre-built Datablock that reports on the data you're looking for, using the Search bar if necessary. Navigate between Favorite Basic, Custom, and Calculated Metrics by clicking on the Show drop-down.
- Pro Tip: All Metrics that you have added to your My Metrics screen will be accessible in the Metric Library as Favorite Metrics.
- Click on the green + button to add the Datablock to your Databoard. Another way to add the Datablock is to drag and drop the selected Datablock onto your Databoard. The Datablock from the Metric Library, will automatically populate with data from the selected Data Source.
- If a pre-built Datablock isn't available for your data, navigate to the Visualization Types section in the Datablock Library on the left-hand side of the Designer.
- Find the visualization you want to add to your Databoard. Click on the Visualization or drag and drop the selected visualization from the Visualization Library to your Databoard. This will automatically produce a blank Datablock on your Databoard.
- Click on the Datablock to open the Datablock Editor on the right-hand side of the Designer. From here, you can select the Data source, Metric, Date Range, and additional customization options for the Datablock.
- Repeat this process for the remaining Datablocks you want to add to your Databoard. You can also click on a blank Datablock to add a Metric.
- Navigate to the Datablock Library on the left-hand side of the Designer to find the Metric Library section.
- Choose the Data Source you want to add to the Databoard from the Data Source drop-down list.
- Search for a pre-built Datablock that reports on the data you're looking for, using the Search bar if necessary. Navigate between Favorite Basic, Custom, and Calculated Metrics by clicking on the Show drop-down.
- Pro Tip: All Metrics that you have added to your My Metrics screen will be accessible in the Metric Library as Favorite Metrics.
- Click on the green + button to add the Datablock to your Databoard. Another way to add the Datablock is to drag and drop the selected Datablock onto your Databoard. The Datablock from the Metric Library, will automatically populate with data from the selected Data Source.
- Click on the Datablock to open the Datablock Editor on the right-hand side of the Designer.
- Navigate to the Metrics Section in the Datablock Editor, click on Add Metric > Select a Metric
- Choose the Metric and Data Source you want to add to the Databoard.