Overview: Client Rollout Strategy
Learn more about how to become a Databox Agency Partner here
After your Databoards are built out, there's still some work to be done to ensure these reports are being used to their fullest potential. This article outlines some ways Agencies can effectively roll out Databox to their Team and to their Clients.
HOW TO
NOTE: This article will be most valuable after your Databoards are created and sent to Client Accounts. Learn more about the recommended Agency Onboarding plan here.
How to Make Data part of your Team's Routine
HOW TO
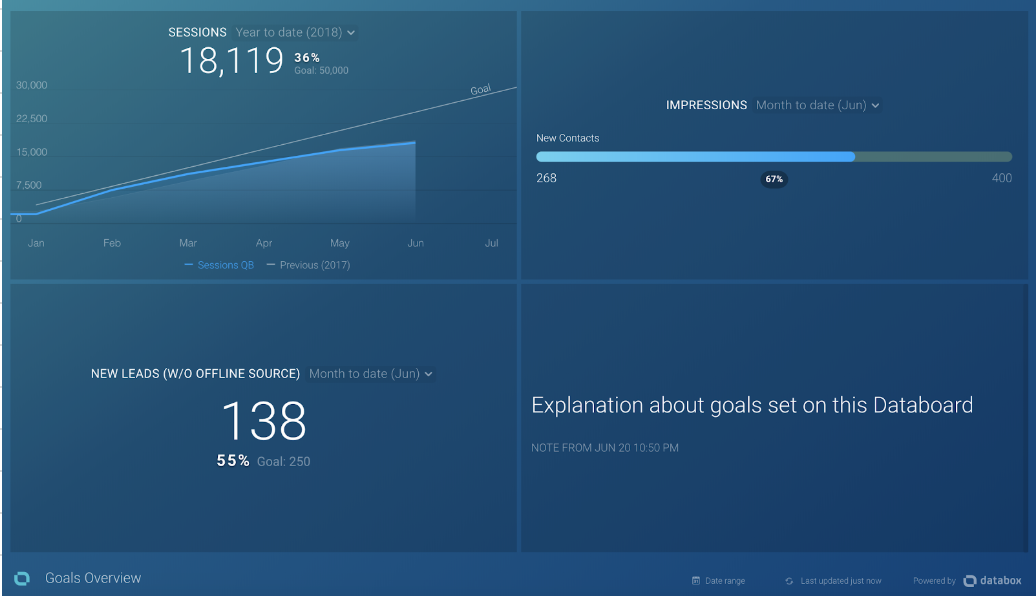
Create an Overview Databoard
While all the Databoards you're creating are valuable, there's typically a lot of information that's displayed. Because of that, it may be difficult for your team to find time to analyze the entire Carousel of reports as often as they should. Creating an Overview Databoard with the most significant Metrics on it (we call these "Primary Metrics") will allow your team to stay up-to-date on the data without being buried in it. We typically recommend displaying ~5 KPIs or Goals on this Overview Databoard. Your Overview Databoard should be the first Databoard looped in your Carousel.

Loop Databoards in Carousel Mode
By looping Databoards in Carousel Mode, you'll generate 1 centralized Streaming URL that allows you to tell a complete, comprehensive story with your data. By reducing the number of places your team and your Clients need to go to view this information, you're increasing the likelihood that they will use data more effectively in their respective roles.
Schedule Snapshots for Team Members
You can then Schedule Snapshots of your Overview Databoard to come to your team at regularly scheduled times. Rather than waiting for them to seek out the data themselves, you can help make it part of their routine by delivering it to their inbox every week, day, etc. In the "body" section of the Scheduled Snapshot, we recommend including the Streaming URL so you're giving your team members one-click access to the near real-time report.
Agencies often Schedule Snapshots to come at the beginning or end of the month. This is a great way to ensure you have archived versions of your monthly reports to reference in the future.
To get even more value from your Databoards, it's recommended that you Schedule Snapshots of Databoard to go to Account Managers every Thursday or Friday morning. That way, all activities from the week are fresh in their minds, so they can more easily draw a correlation between the work they're doing and the effect on the Client's business. Not only does this help Account Managers become more data-driven, but it also equips them with the info they need to better communicate the value of your Agency's work to the Client.
How to Make Data part of your Client's Routine
HOW TO
- Walk through the Carousel of Databoards together with your Client
- Record video using Soapbox, Loom, etc.
- Set Goals together with Clients
Walk through the Carousel of Databoards together with your Client
One of the huge value-adds of working with an Agency is added experience and expertise. Simply sending the Streaming URL to your Clients does not suffice. These reports should be discussed in detail with your Clients, especially in the earlier stages of introducing them. Sharing some information on why you included the Metrics you did in your reports, how you chose to combine the data, some key areas to focus on, etc. will make the reports you've created much more valuable to your Clients.
Record video using Soapbox, Loom, etc.
The Carousel of Databoards that you already created will act as the basis for what you develop moving forward and, unless you're giving your reporting process a complete overhaul, these reports will rarely have major changes made to them. Therefore, it's extremely important to make sure your Clients are comfortable with the Carousel of Databoards you built.
To provide a valuable resource for your Clients, we recommend recording a video of yourself walking through the Carousel of Databoards using Soapbox, Loom, or any other recording tool. While the data on the Databoard will constantly update, the general structure will likely stay the same so it's important to highlight the significance of the Databoard structure more-so than the actual Metric values on it. By creating a resource that shows how an expert interprets the Databoards, your Clients will be better equipped to analyze and understand the Databoards on their own.
Set Goals together with Clients
In order to ensure you have the same definition of success and are working towards the same objectives, we recommend setting Goals with your Clients. Will they fire you if you bring in 100 Leads in a month, or will they fire you at 10 Leads? This is key to strengthening your relationships with Clients.
Within Databox, you can set up Daily, Weekly, Monthly, Quarterly and Yearly Goals. Further, you can set individual monthly goals to help you stay on track towards hitting quarterly or yearly goals you have set. Being able to view your current progress against your goal values are important to keep momentum and to encourage your team.