
Availability
HubSpot Marketing is an all-in-one marketing platform that helps teams attract visitors, convert leads, and run campaigns across email, blogs, landing pages, and social channels. It provides reporting on content performance, contact lifecycle stages, email engagement, and automation workflows, giving marketers a centralized view of what is driving growth. Connecting HubSpot Marketing to Databox lets you bring that data into your dashboards and reports alongside your other tools, and build custom metrics by blog post, email title, contact property, landing page, or workflow that go beyond what the basic metrics provide.
If your credentials don't include full access to the data source, make sure your access level meets any permission requirements listed in the Specification section of the integration's page in the Metric Library.
To connect HubSpot Marketing to your Databox account for the first time, log in using your HubSpot credentials.
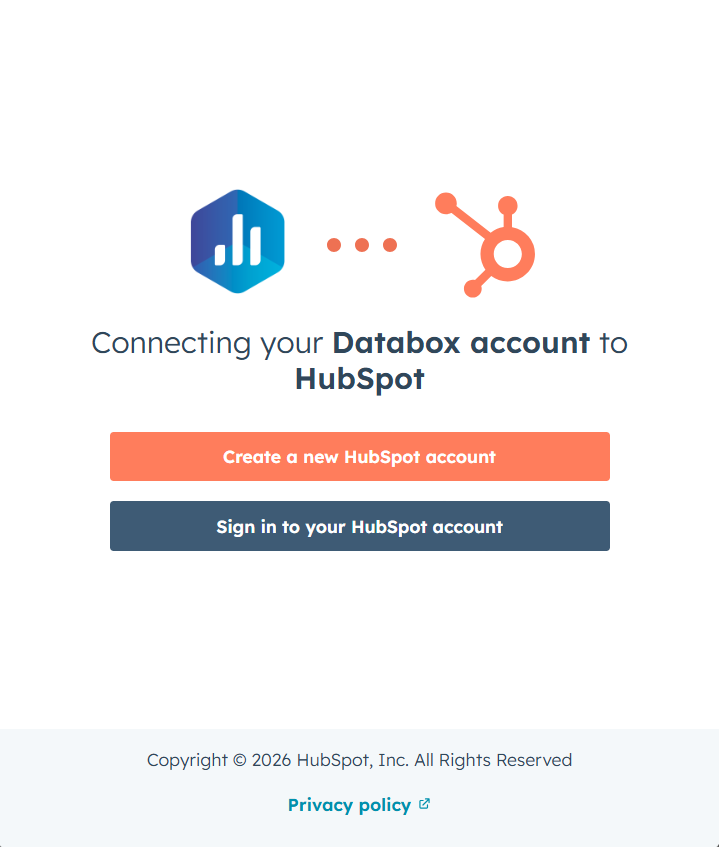
Select the HubSpot account you want to connect to Databox.
HubSpot will display the list of permissions Databox needs to access your data. Review these carefully, then accept the terms to proceed.
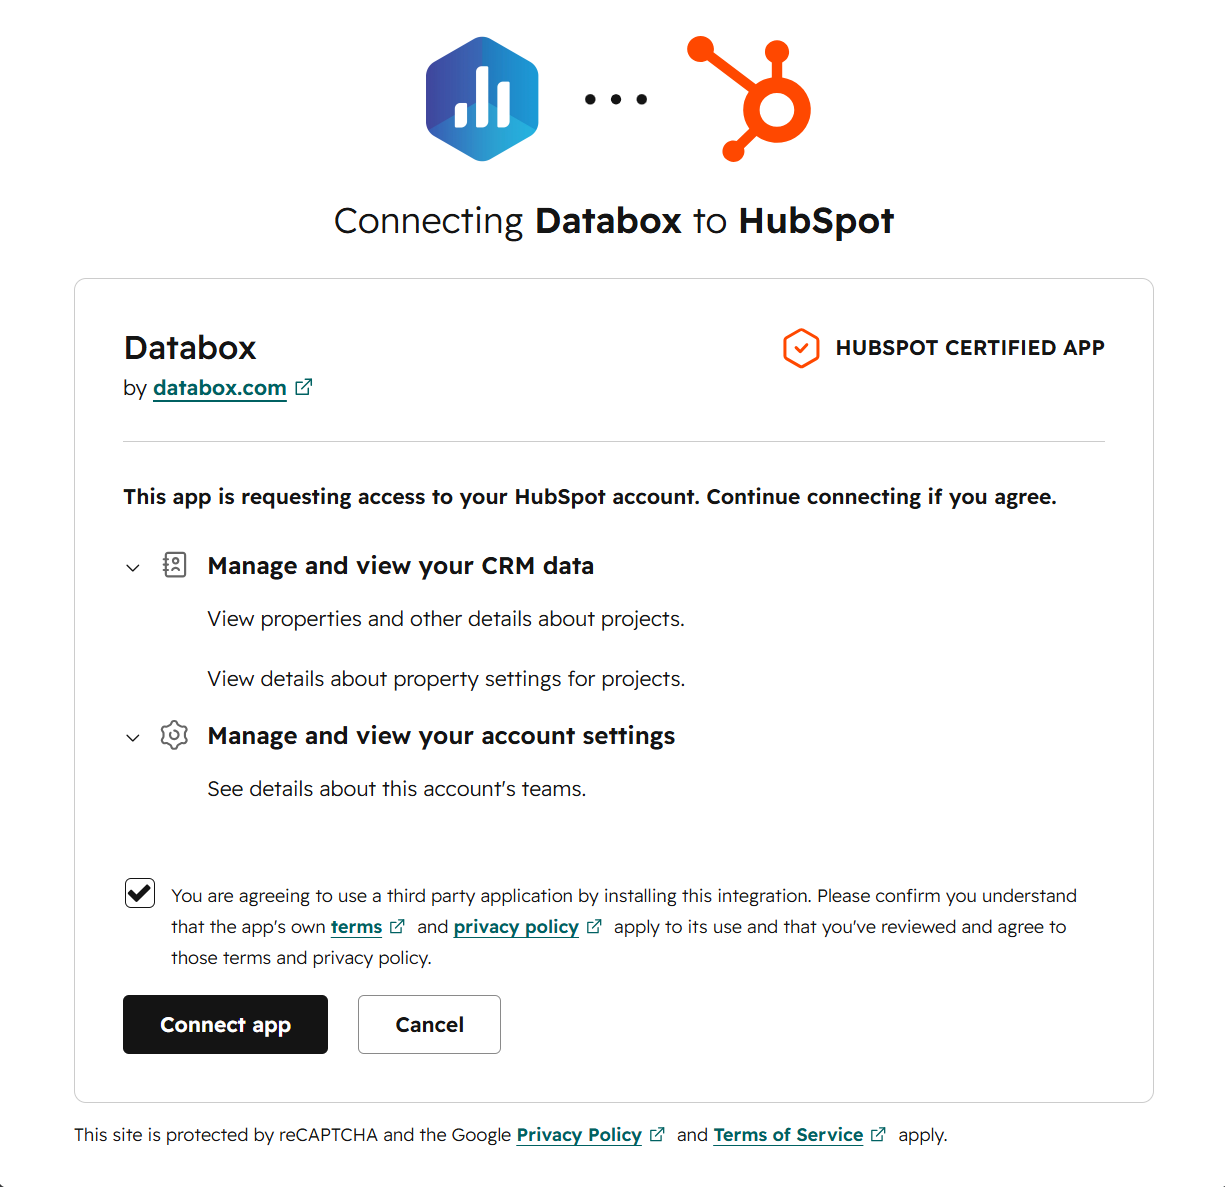
Click Connect app to grant Databox access to your HubSpot account and complete the connection.
To remove the HubSpot Marketing integration, you can either uninstall the Databox app from your HubSpot account or delete the connection from within Databox. These two actions have different effects on your data, so it's worth understanding the distinction before proceeding.
Uninstall from HubSpot removes Databox's access at the source. Follow the steps in HubSpot's documentation to uninstall the app from your HubSpot account. This stops Databox from syncing any new data from HubSpot, but all data already synced to your Databox account remains intact.
Delete the connection or data source in Databox removes the integration from the Databox side. Follow the steps to delete the connection or delete the data source from within Databox — either action will remove both. This stops future syncs and permanently purges all HubSpot Marketing data already synced to your account.
The HubSpot Marketing integration allows you to create custom metrics using the metric builder, ideal for visualizing data not included in the basic metrics offered by the integration.
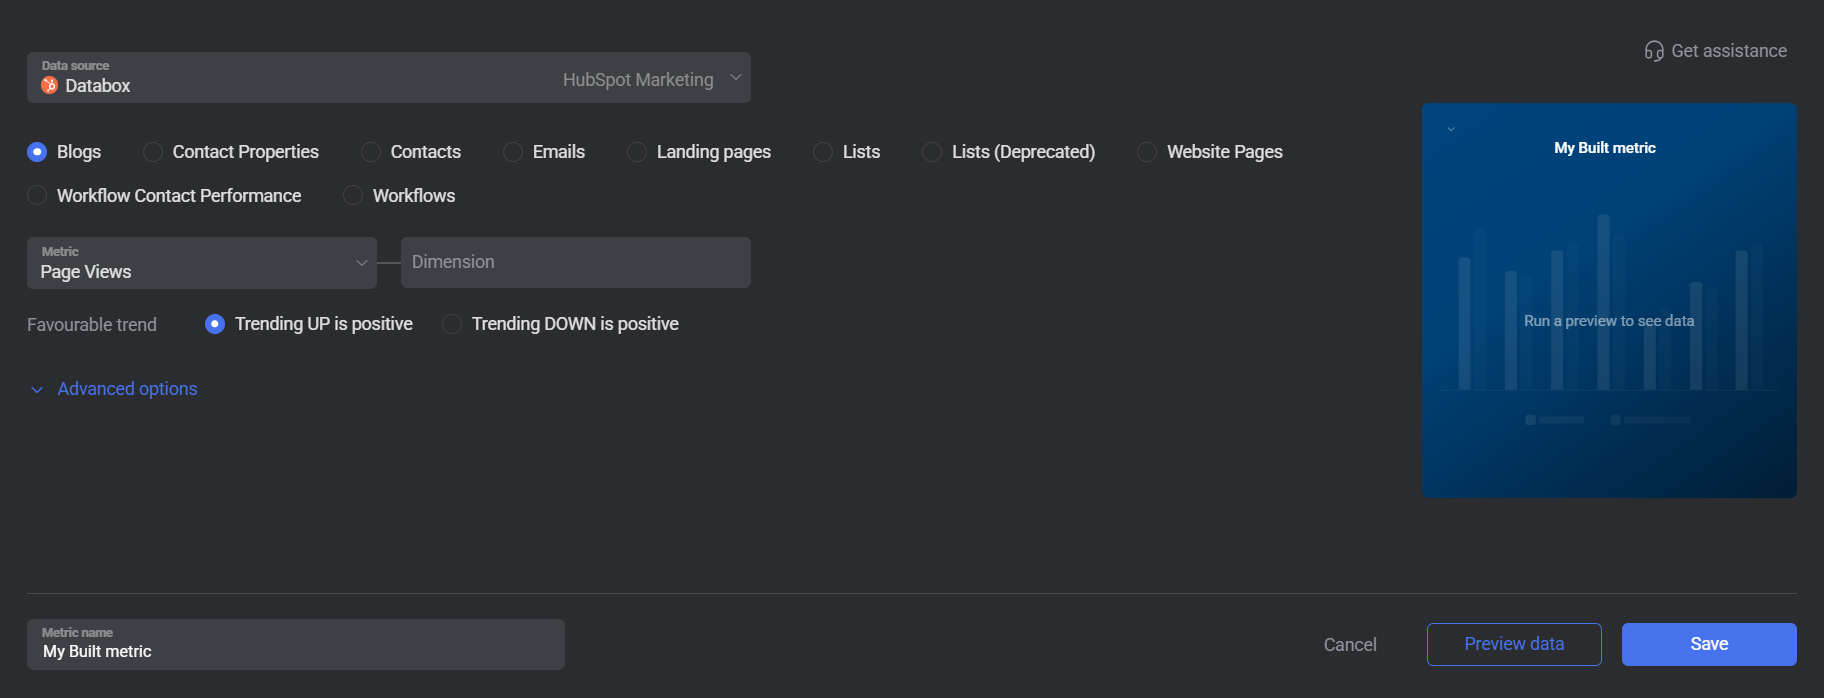
To create a custom metric, start by selecting a metric from the Metric selector. Next, customize your metric by optionally adding a dimension and applying one or more filters. The available options depend on the selected entity and data type (e.g., number, text, etc.).
The entities accessible for metric creation are listed below.
Blogs represents the blog posts published in your HubSpot Marketing account. Use the Blogs entity to track content performance metrics such as page views, bounce rate, CTA clicks, and average time on page across individual blog posts. Metrics can be broken down by Blog Post Title or Blog Post URL, and filtered by blog post, campaign, or author.
 In HubSpot Marketing: Go to the Content > Blog section.
Contact Properties represents the custom and standard fields associated with contact records in your HubSpot Marketing account. Use the Contact Properties entity to build metrics that count or measure contacts segmented by a specific property value — for example, counting new contacts by owner, company size, or a custom dropdown field.
In HubSpot Marketing: Go to the CRM > Contacts section and open any contact record to view its properties.
Contacts tracks how contacts move through HubSpot's lifecycle stages over time. Use the Contacts entity to measure how many contacts became a lead, a marketing qualified lead, a sales qualified lead, a customer, a subscriber, an evangelist, an opportunity, or another lifecycle stage during a selected period. Metrics can be broken down by Original Source, Owner, or HubSpot Team ID to understand which channels and team members are driving lifecycle progression.
In HubSpot Marketing: Go to the CRM > Contacts section.
Emails tracks engagement data for the marketing emails sent from your HubSpot Marketing account. Available metrics include Bounced, Clicked, Contacts lost, Delivered, Dropped, Hard bounced, Not sent, Opened, Pending, and Selected. Metrics can be broken down by Title to compare performance across individual emails, and you can filter to specific emails using the Select Emails section or an email name filter.
In HubSpot Marketing: Go to the Marketing > Email section.
Landing pages tracks performance data for the landing pages in your HubSpot Marketing account. Use the Landing pages entity to measure page views, bounce rate, form submissions, CTA views, new contacts, marketing qualified leads, and more across individual pages. Metrics can be broken down by Landing Page or Landing Page URL and filtered by page or metric value.
In HubSpot Marketing: Go to the Content > Landing Pages section.
Lists allows you to track contact list membership over time using data from HubSpot's List Performance report. When you select the Lists entity, you choose a specific List from your HubSpot account rather than selecting a generic metric. Data is only available from the date the list was created — no data exists prior to the list creation date.
In HubSpot Marketing: Go to the CRM > Segments (Lists) section.
Website pages tracks analytics data for the website pages hosted in your HubSpot Marketing account. Use the Website pages entity to measure metrics such as average bounce rate, average time on page, bounces, page views, CTA clicks, CTA rate, CTA views, entrances, exit rate, and exits.
In HubSpot Marketing: Go to the Content > Website Pages section.
Workflow Contact Performance tracks how individual contacts move through a specific workflow. When you select this entity, you first choose a Workflow from your HubSpot account, then select a metric that reflects contact activity within that workflow — such as completed workflow, contacts enrolled, or contacts lost. This entity is useful for measuring the effectiveness of individual nurture sequences and onboarding flows at the contact level.
In HubSpot Marketing: Go to the Automation > Workflows section.
Workflows tracks aggregate enrollment data for your HubSpot automation workflows. When you select this entity, you first choose a Workflow from your HubSpot account, then select from two metrics: Active Enrolled (the number of contacts currently active in the workflow) or Total Enrolled (the cumulative number of contacts enrolled). This entity is useful for monitoring the reach and activity level of your automation programs over time.
In HubSpot Marketing: Go to the Automation > Workflows section.

The HubSpot Marketing integration supports the creation of datasets, which allow you to structure and format your HubSpot Marketing data for more flexible reporting in Databox. By organizing your data into a tabular format, datasets make it easier to filter, segment, and visualize key metrics across projects, clients, and team members.
The entity relationship diagram (ERD) below illustrates how data is organized within the HubSpot Marketing integration, displaying the available views and columns, as well as the relationships between them (primary and foreign keys). This diagram represents the schema, or structure, of the data and helps you understand the underlying data model. With this context, you can create datasets using the relevant views and columns to build custom metrics tailored to your reporting needs.
For comprehensive details on metrics, data availability, templates, specifications, usage guidelines, and other key information, refer to the resources listed below.


FAQ
What is the difference between the HubSpot CRM, HubSpot Marketing, HubSpot Service, and HubSpot Custom Objects integrations in Databox?
Each HubSpot integration in Databox pulls data from a different part of the platform:
- HubSpot CRM — deals, companies, and sales engagement activities such as calls, meetings, notes, emails, and tasks.
- HubSpot Marketing — email campaigns, blog post and landing page performance, contact lifecycle stages, and automation workflows.
- HubSpot Service — tickets, ticket pipelines, and service workflows.
- HubSpot Custom Objects — user-defined record types your team has created in HubSpot Enterprise, such as Shipments, Vehicles, or Memberships, that don't fit the standard object structure.
You can connect all four integrations to the same Databox account to get a unified view across your entire HubSpot data model.
Why are certain entities or properties unavailable in the metric builder?
The metric builder pulls raw and analytics data from HubSpot's APIs. If an entity or property is missing, it is likely due to limited API support or technical implementation restrictions. If there's something you'd like to see included, feel free to submit a request, so we can consider it for future updates to the integration.


