
Semrush is an all-in-one SEO and digital marketing platform that helps businesses improve search visibility, analyze competitors, and track keyword performance across organic and paid channels. It provides tools for position tracking, backlink analysis, keyword research, and competitive intelligence. Connecting Semrush to Databox brings your ranking data, visibility trends, and competitor metrics into a centralized reporting environment, making it easier to monitor SEO performance and communicate progress to stakeholders.
If your credentials don't include full access to the data source, make sure your access level meets any permission requirements listed in the Specification section of the integration's page in the Metric Library.
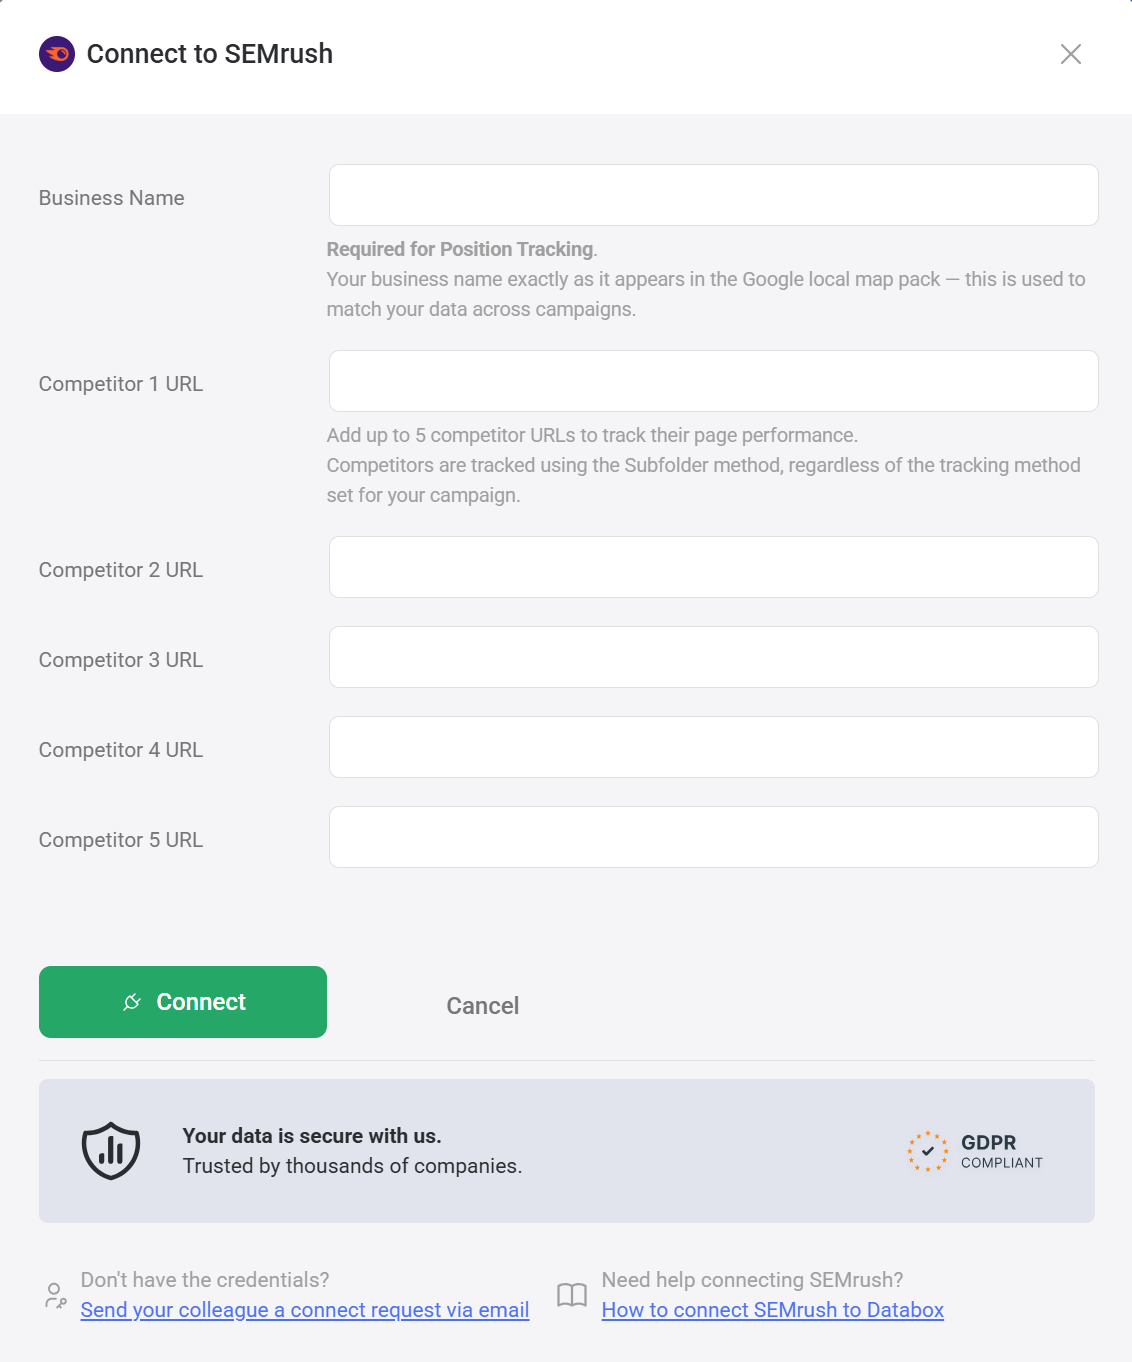
To connect Semrush to your Databox account for the first time, complete the following fields in the connection dialog:
- Business Name — Enter your business name exactly as it appears in the Google local map pack in Semrush. Required for Position Tracking and used to match data across campaigns. If you track multiple Position Tracking campaigns, each must be added as a separate Data Source with a matching Business Name. To find it in Semrush, go to Management > Projects, select the project, open Position Tracking, click the Settings icon, select Tracking + Project Name, and copy the value from the Business Name for Local Map Pack field.
- Competitor 1 URL through Competitor 5 URL — Optionally add up to 5 competitor URLs to track their page performance. Competitors are tracked using the Subfolder method, regardless of the tracking method set for your campaign.
- Click the green Connect button to proceed.
After entering your connection details, you will be redirected to sign in to your Semrush account and authorize Databox to access your data.
Select the Semrush Project you want to connect to Databox.
Select the Campaign within the project you want to report on. Each campaign you want to report on must be added as a separate Data Source in Databox.
Select the Target Type that matches the tracking setup configured in your Semrush campaign. The four options in the Databox UI correspond directly to the target type options in Semrush.
Select the Region/Database that matches the database configured for your Semrush campaign. This setting affects Competitive Research and Keyword Research metrics — if it does not match what is configured in Semrush, data discrepancies are likely to occur.
For comprehensive details on metrics, data availability, templates, specifications, usage guidelines, and other key information, refer to the resources listed below.


FAQ
Can I change the project domain after connecting?
No. The project domain cannot be changed after a project is created in Semrush. If the domain was entered incorrectly (for example, with www), you will need to create a new project in Semrush and migrate your historical data to it, then reconnect in Databox.
Can I edit the Business Name or competitors for an existing Data Source?
You cannot edit these fields yourself once a Data Source has been created. Contact help@databox.com with the Databox account(s) and Semrush Data Source(s) you'd like to update, and the support team will make the change for you.
Do I need a specific Semrush plan or API access to connect?
No. All Semrush plans can be connected to Databox. API units are not required — Databox accesses your Semrush data using your login credentials via OAuth.
Why are some Semrush metrics showing no data after connecting?
Several factors can cause missing data: Position Tracking may not be configured in Semrush, the project domain may include www (use urlname.com instead of www.urlname.com), the selected Region/Database may not match your Semrush campaign, or competitor-specific metrics require competitor URLs to be specified during connection. Check each of these settings if metrics appear empty or return errors.
Why can't I find a Semrush metric I was previously using?
Some metrics that previously appeared by name (e.g. "Backlinks by Competitor") are now available as dimensions within a new placeholder metric (e.g. "By Competitor Metrics"). Select the new metric and then apply the corresponding dimension using the Breakdown by selector to find your data.


