
Copper is a CRM built for Google Workspace that helps businesses manage leads, track deals, and maintain customer relationships without leaving their existing tools. It organizes contacts, pipelines, and sales activity in one place, making it easy for teams to monitor follow-ups, spot bottlenecks, and close more deals. Connecting Copper to Databox brings your pipeline and opportunity data into a centralized reporting environment, so you can track performance across pipelines, visualize trends over time, and combine sales insights with data from other tools.
If your credentials don't include full access to the data source, make sure your access level meets any permission requirements listed in the Specification section of the integration's page in the Metric Library.
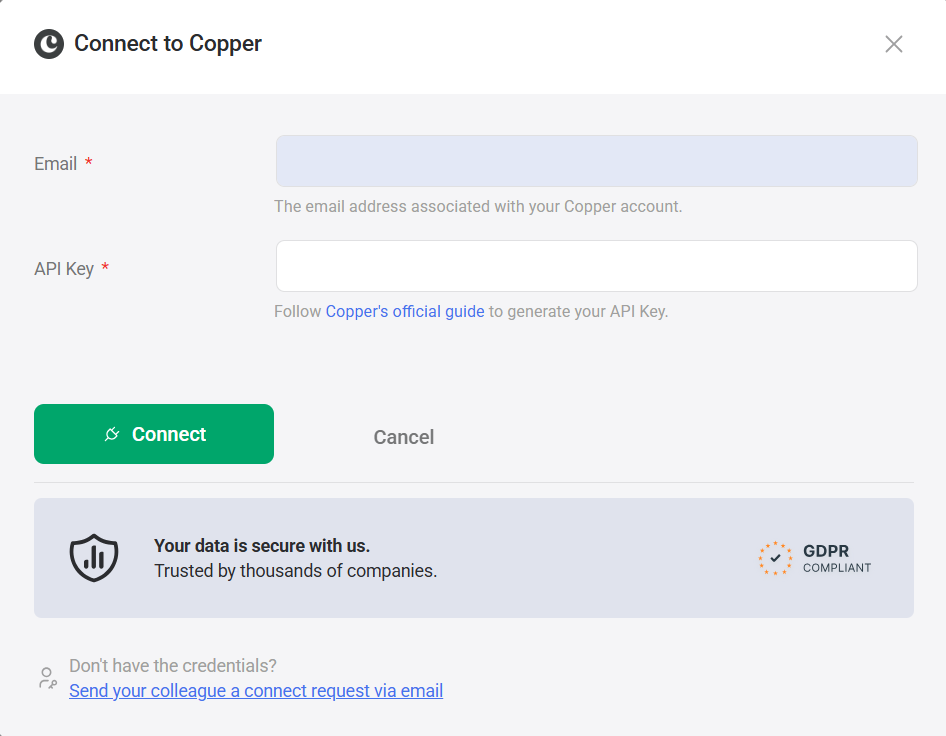
Follow Copper's official guide to generate your API Key.
Keep your Copper account email address and API Key available. You will need both in the next step.
To connect Copper to your Databox account for the first time or with a new set of credentials, enter the following:
- Enter the Email address associated with your Copper account.
- Enter the API Key generated in Step 1.
- Click Connect.
After connecting, select a Pipeline from the list of pipelines available in your Copper account. Each pipeline you connect becomes a separate data source in Databox.
The Copper integration allows you to create custom metrics using the metric builder, ideal for visualizing data not included in the basic metrics offered by the integration.
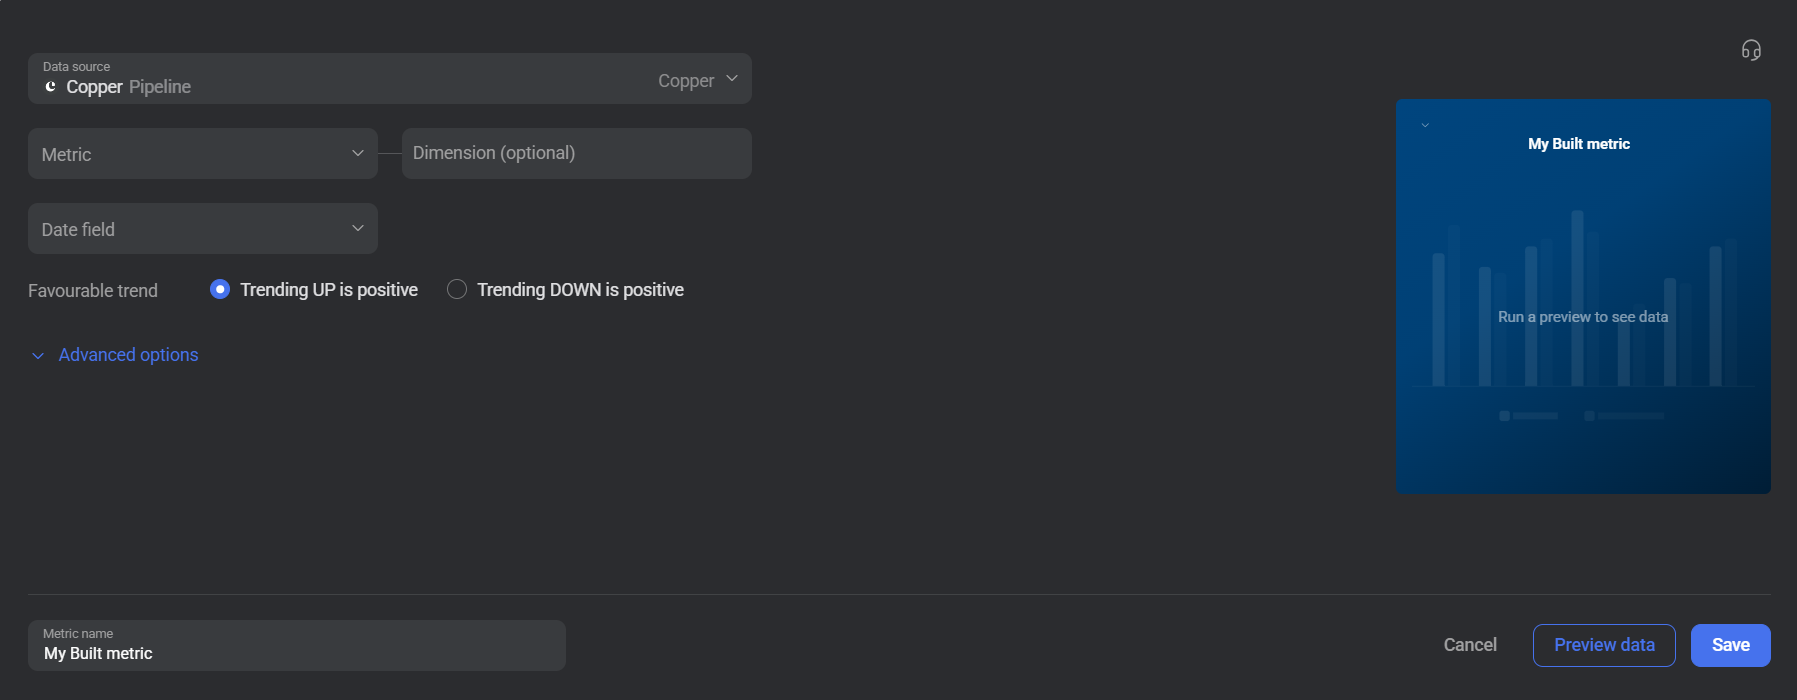
To create a custom metric, start by selecting a metric from the Metric selector. The builder is built around opportunity data from the connected pipeline, letting you measure counts and monetary values. You can segment results by dimensions such as assignee, stage, status, or lead source, and scope the data to a relevant date field. Use Advanced options to apply additional filters and narrow results further.
For comprehensive details on metrics, data availability, templates, specifications, usage guidelines, and other key information, refer to the resources listed below.


FAQ
Why are certain metrics or dimensions unavailable in the metric builder?
The metric builder pulls data from Copper's API. If an option is missing, it may not be exposed through the API or may not yet be supported in the integration. You can submit a request to suggest it for a future update.


