
Availability
Google Ads is Google's online advertising platform that enables businesses to reach customers across Google Search, YouTube, the Display Network, and partner sites through pay-per-click, video, and display ad formats. It supports campaigns at every stage of the funnel — from awareness to conversion — and provides detailed performance data at the account, campaign, ad group, and ad level. Connecting Google Ads to Databox brings that performance data into a unified reporting environment alongside your other paid channels, so you can monitor spend efficiency, track conversions, and build dashboards that support faster, better-informed decisions.
If your credentials don't include full access to the data source, make sure your access level meets any permission requirements listed in the Specification section of the integration's page in the Metric Library.
To connect Google Ads to your Databox account for the first time:
- Enter your Email or phone on the Google sign-in screen and click Next.
- Enter your password.
- Complete the 2-step verification prompt to finish signing in.
If you've already established a connection, you can reuse it to add new accounts, as long as those accounts are accessible with the existing connection's credentials.
After signing in, select the Google Ads manager account (MCC) you want to use for this connection. If your Google account has access to multiple manager accounts, choose the one that contains the customer account you want to report on.
Choose the Google Ads customer account you want to report on. If the manager account contains multiple customer accounts, you will be prompted to select the specific account you want to connect to Databox.
The Google Ads integration allows you to create custom metrics using the metric builder, ideal for visualizing data not included in the basic metrics offered by the integration.
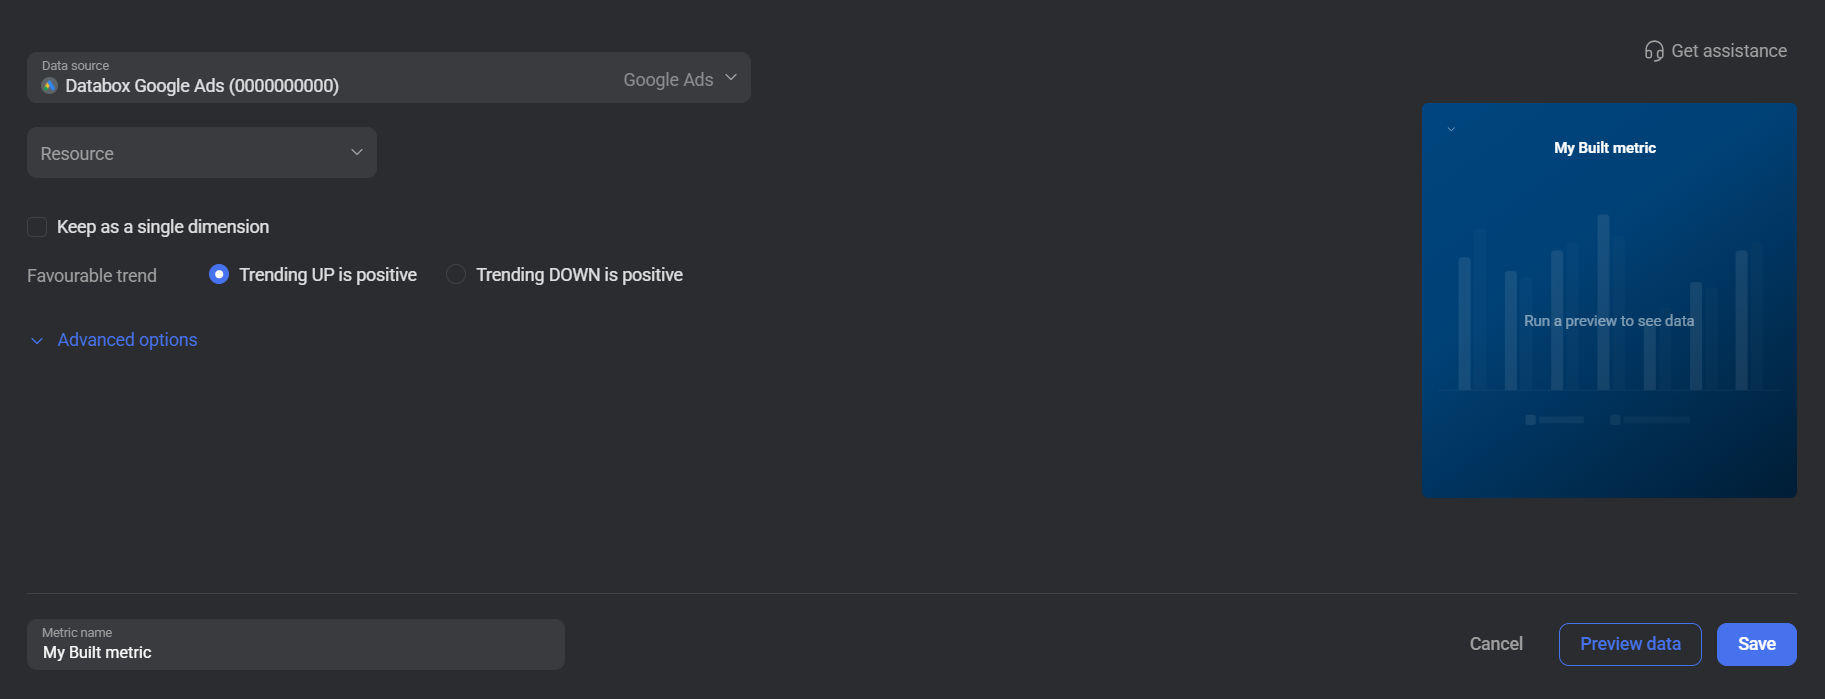
To create a custom metric, start by selecting a resource from the Resource dropdown. The Google Ads metric builder exposes a wide range of resources — from core entities like Campaign, Ad Group, and Keyword to more granular views such as Geographic View, Shopping Product, and Video Enhancement. Next, select a Metric, then optionally add a Dimension and apply one or more filters using Advanced options. The available metrics and dimensions depend on the selected resource.

The Google Ads integration supports the creation of datasets, which allow you to structure and format your Google Ads data for more flexible reporting in Databox. By organizing your data into a tabular format, datasets make it easier to filter, segment, and visualize key metrics across projects, clients, and team members.
The entity relationship diagram (ERD) below illustrates how data is organized within the Google Ads integration, displaying the available views and columns, as well as the relationships between them (primary and foreign keys). This diagram represents the schema, or structure, of the data and helps you understand the underlying data model. With this context, you can create datasets using the relevant views and columns to build custom metrics tailored to your reporting needs.
For comprehensive details on metrics, data availability, templates, specifications, usage guidelines, and other key information, refer to the resources listed below.


FAQ
Why are certain resources or metrics unavailable in the metric builder?
The metric builder pulls data from the Google Ads API, and the available resources and metrics reflect what the API exposes for the connected customer account. If a resource or metric you expect is missing, it may not be supported for your account type or campaign type.


