
When performance data shifts, it's not always obvious why. Annotations let you attach short text notes to specific points on a chart — marking events like campaign launches, product releases, or seasonal promotions directly where they appear in the data. This makes it easier to correlate what happened with what changed, whether you're reviewing data yourself or sharing a Databoard with your team.
Annotations require chart types that report with time-based granularity. They are supported on line, bar, combo, and heatmap visualizations.
Access follows Databoard permissions. Anyone who can view a Databoard can view its annotations — in the app, on internal or shareable links, and on embedded Databoards. Anyone who can edit a Databoard can add, edit, and delete annotations. These controls are available in the Designer, in view mode, and on internal or shareable links when logged in.
- Open a Databoard that contains a supported visualization.
- Hover over the x-axis at the point in time where you want to add the annotation. A
 icon appears on the axis.
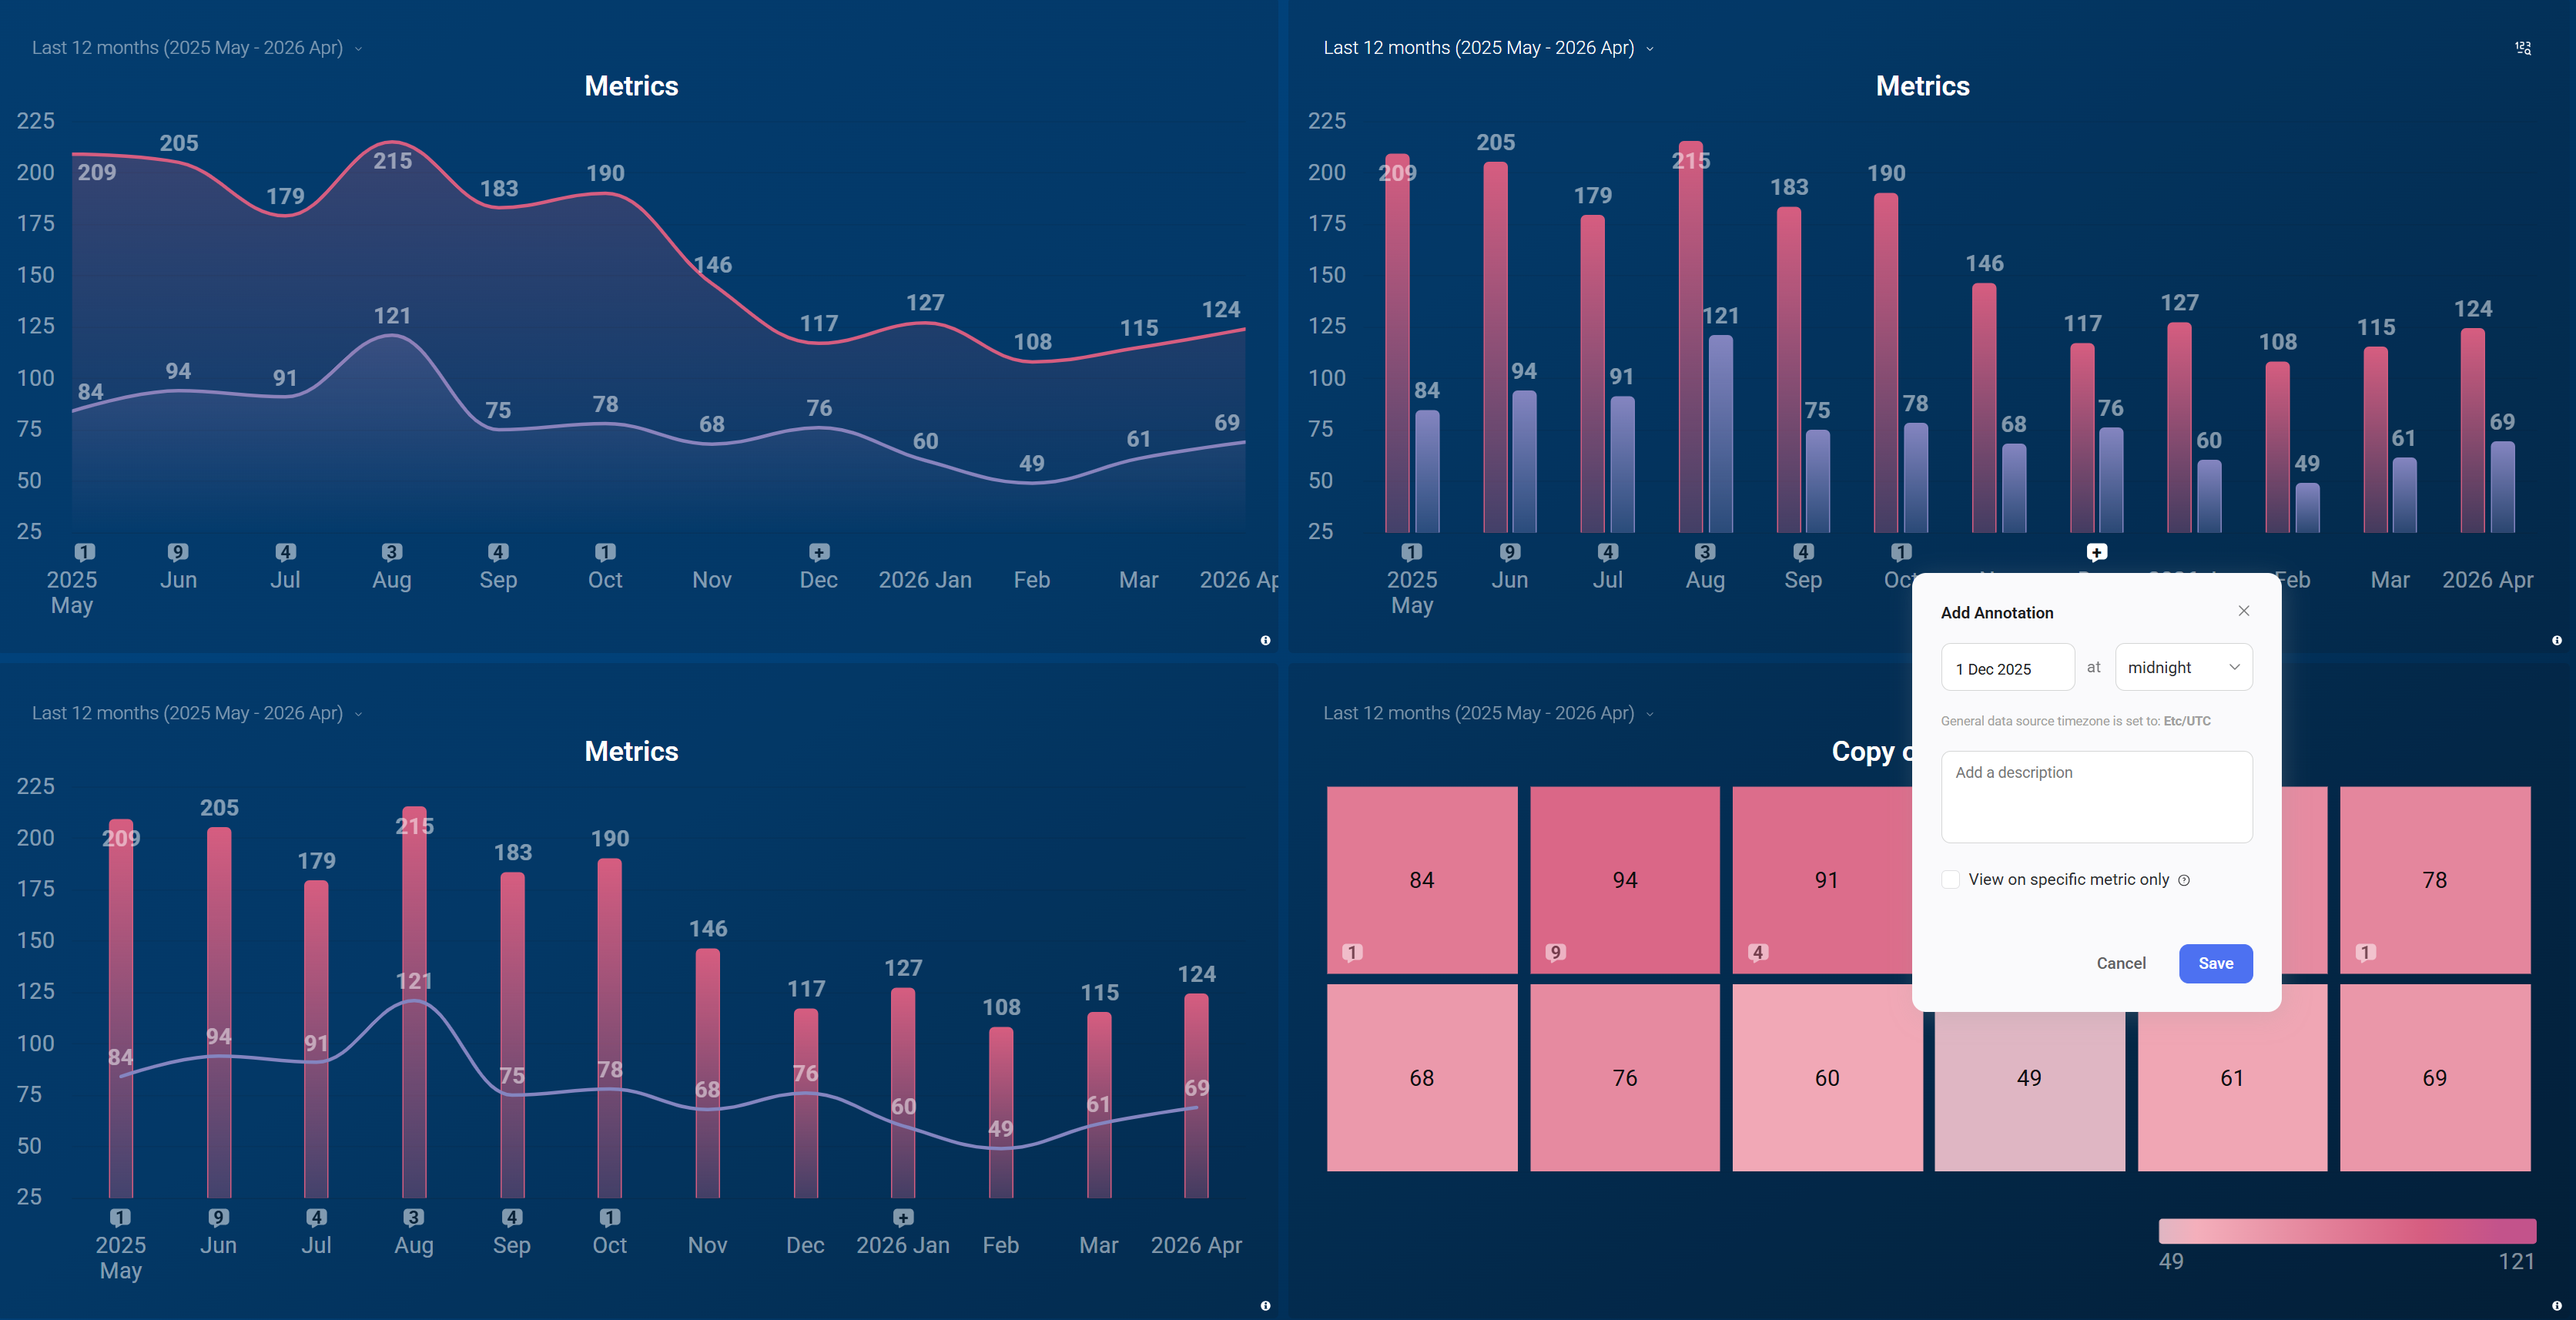
 - Click + to open the Add Annotation dialog.
- Set the date and time for the annotation. The timezone shown below the date field reflects your general data source timezone.
- Enter a description in the text field. You can include a URL — it becomes a clickable link once the annotation is saved.
- (Optional) Check View on specific metric only to limit visibility to this specific metric. When unchecked, the annotation appears globally on all supported charts across the account at that point in time.
- Click Save.
Saved annotations appear as numbered markers on the x-axis of the chart. The number indicates how many annotations exist at that point in time. Click a marker to read the annotation content.
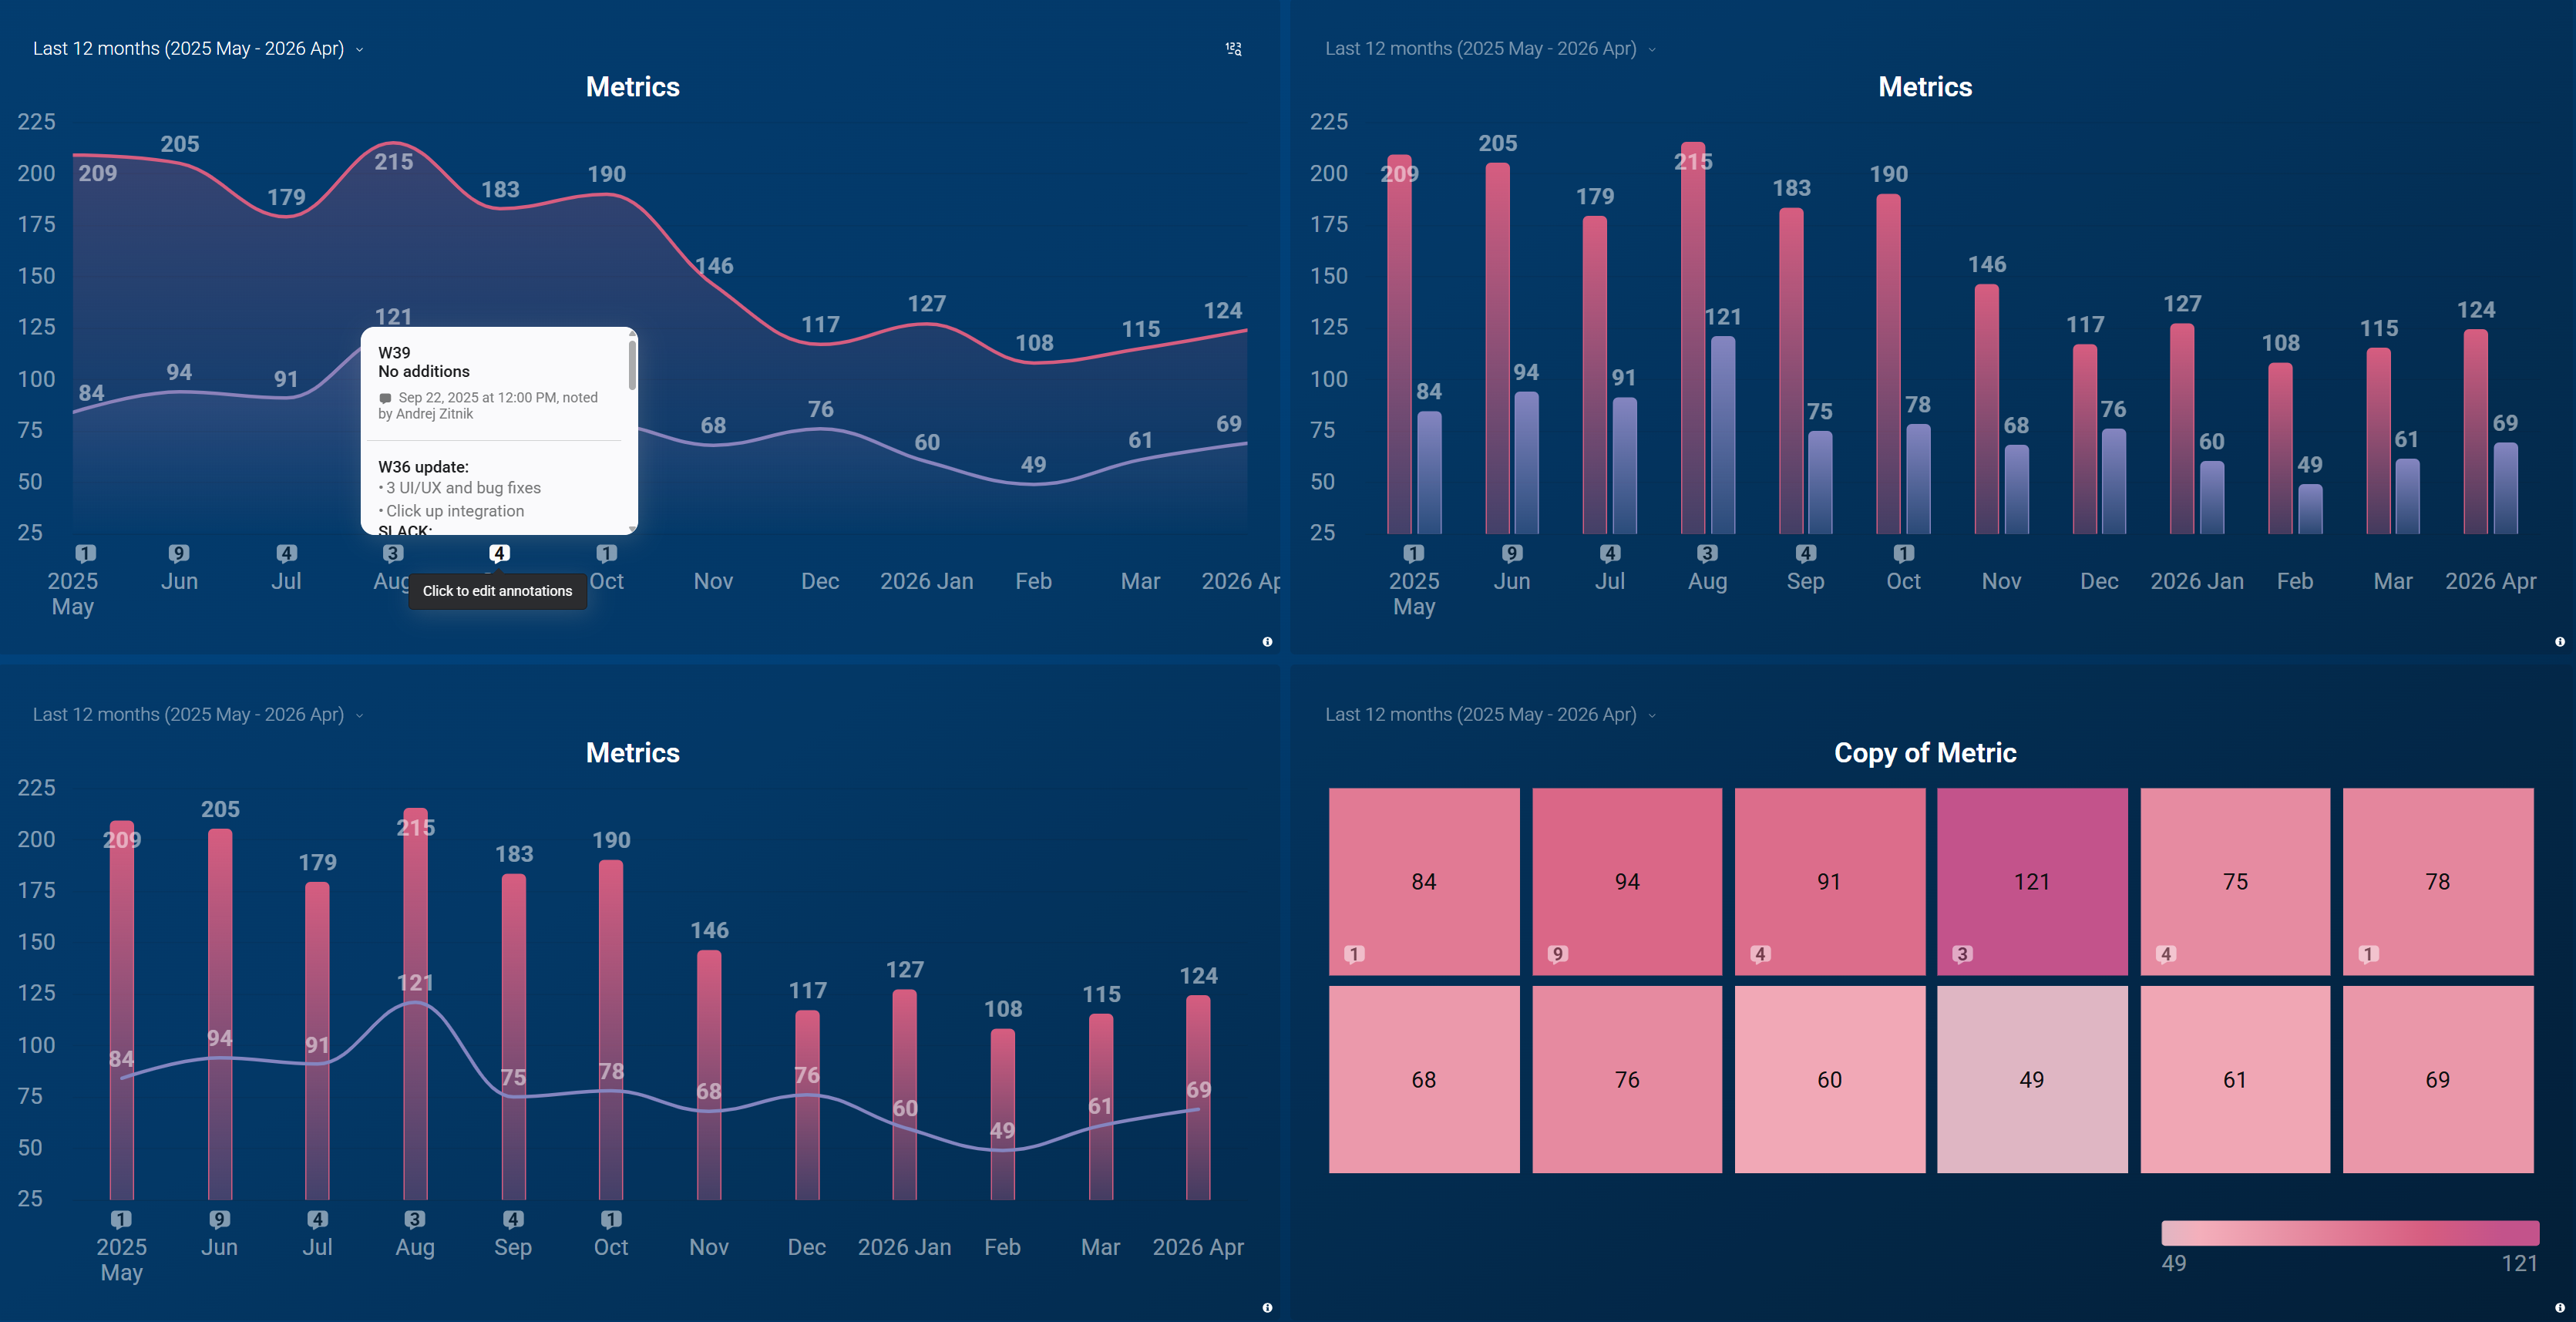
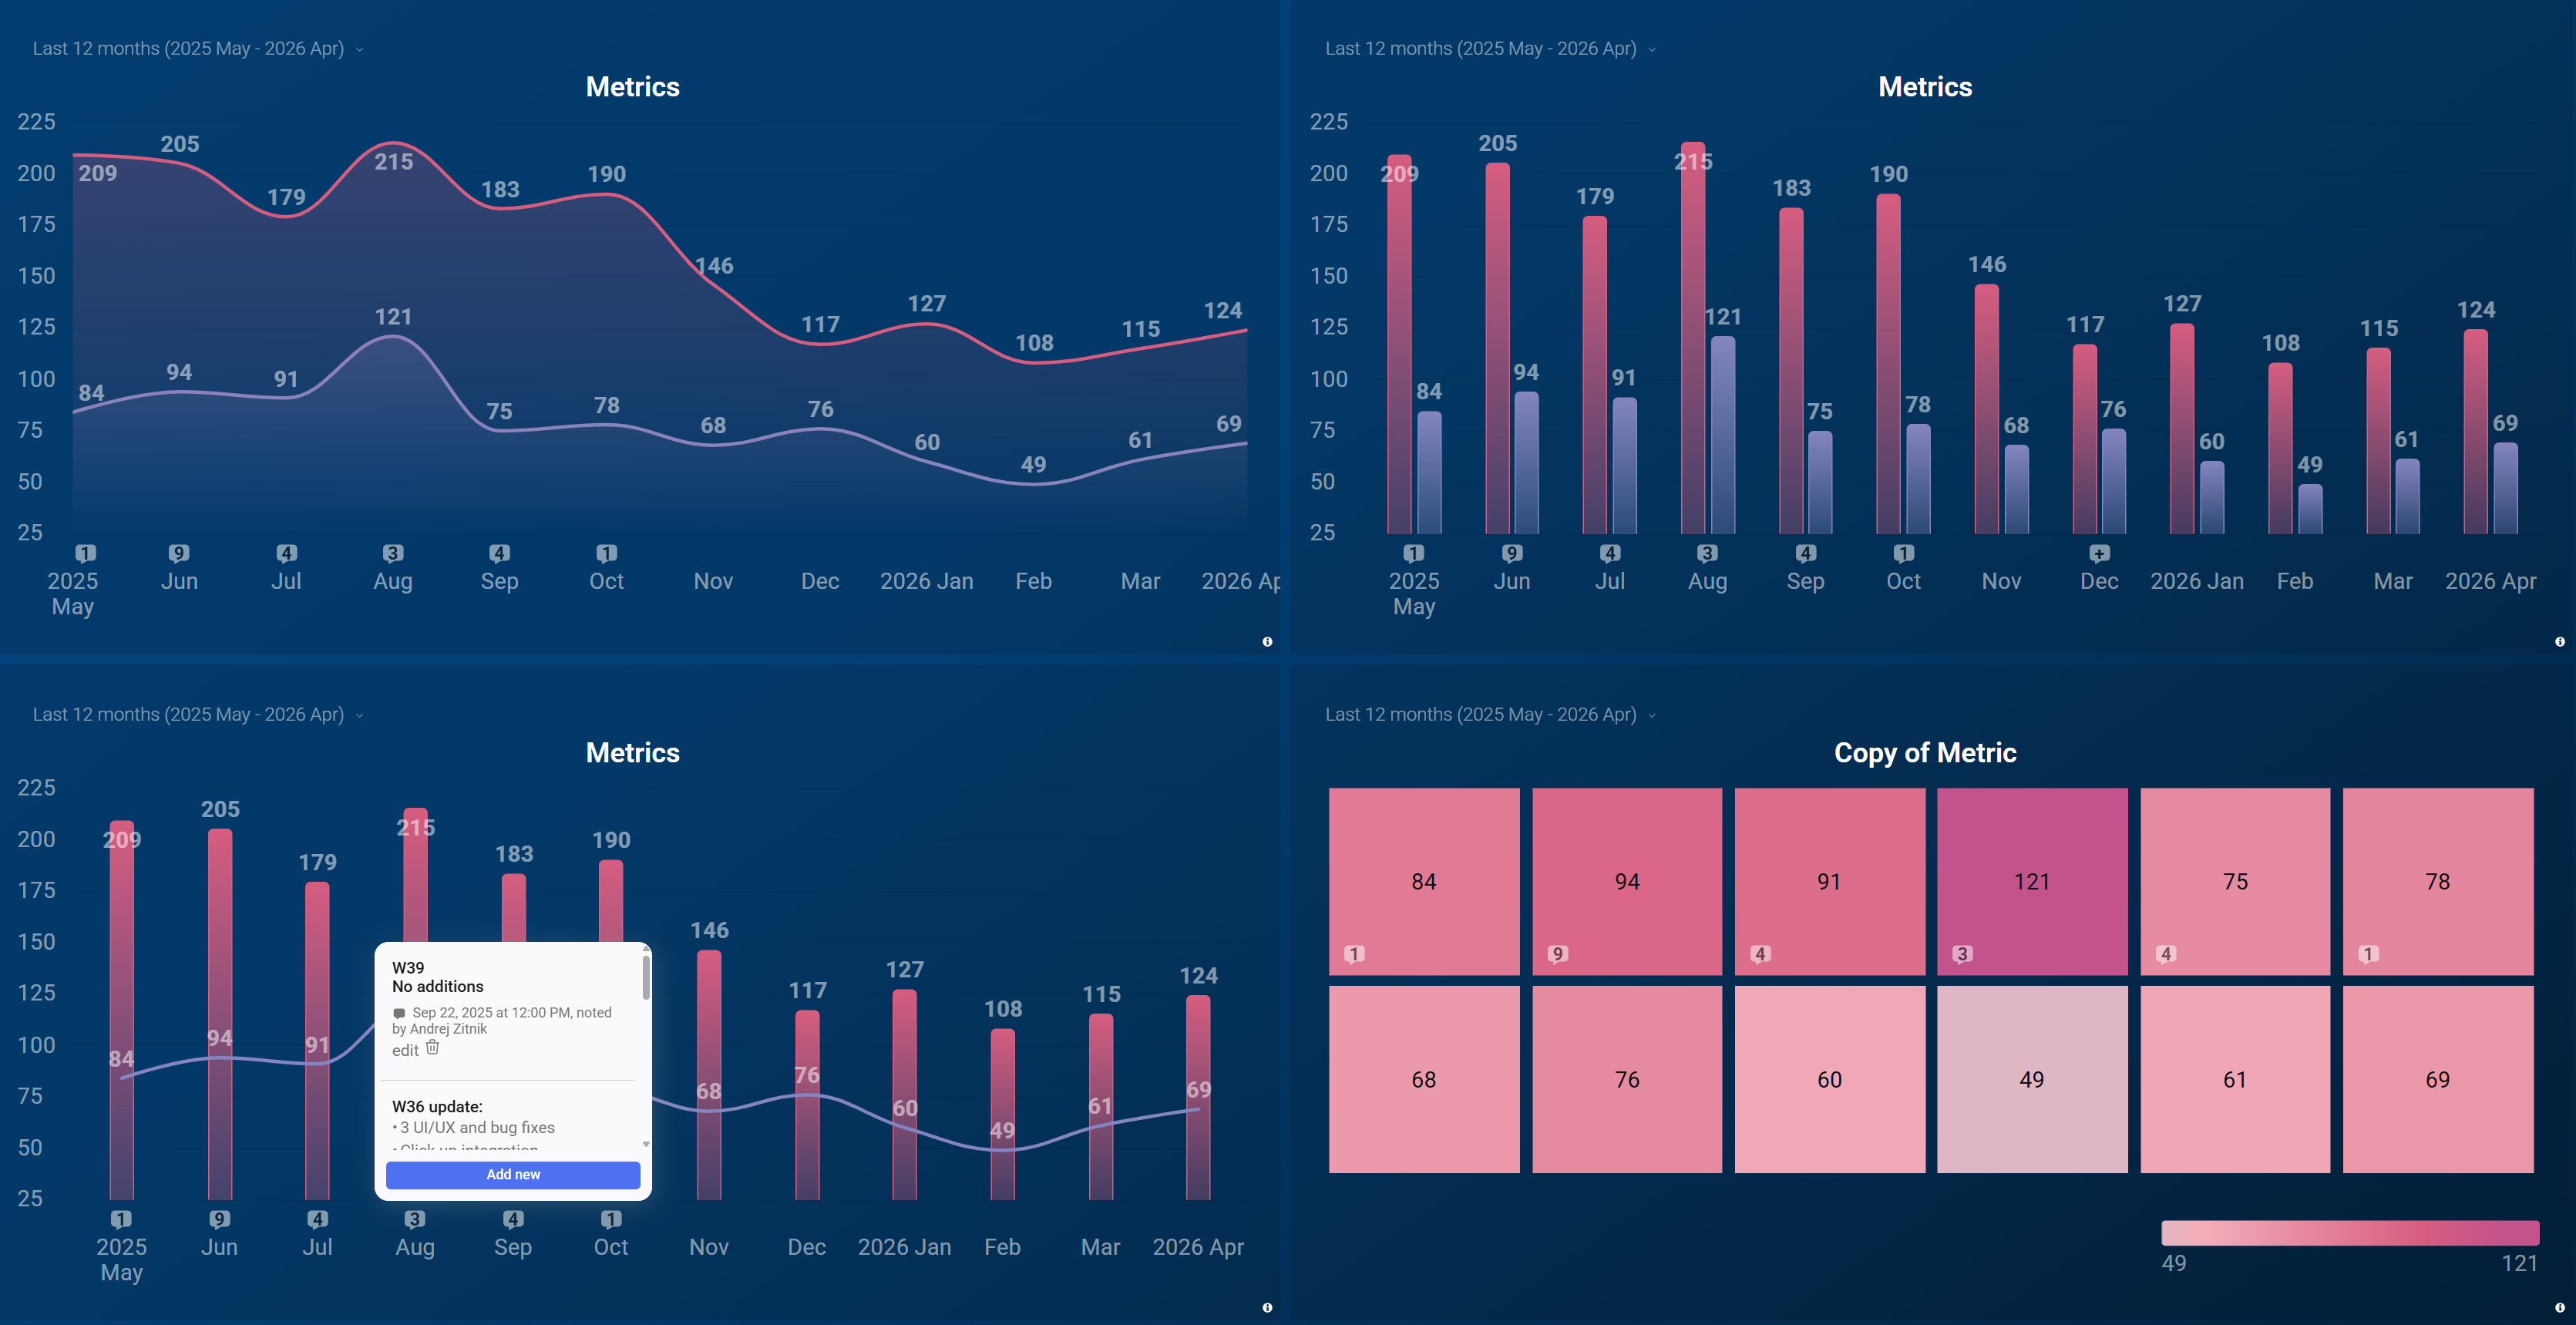
- Click the annotation marker on the chart to open the annotation popup.
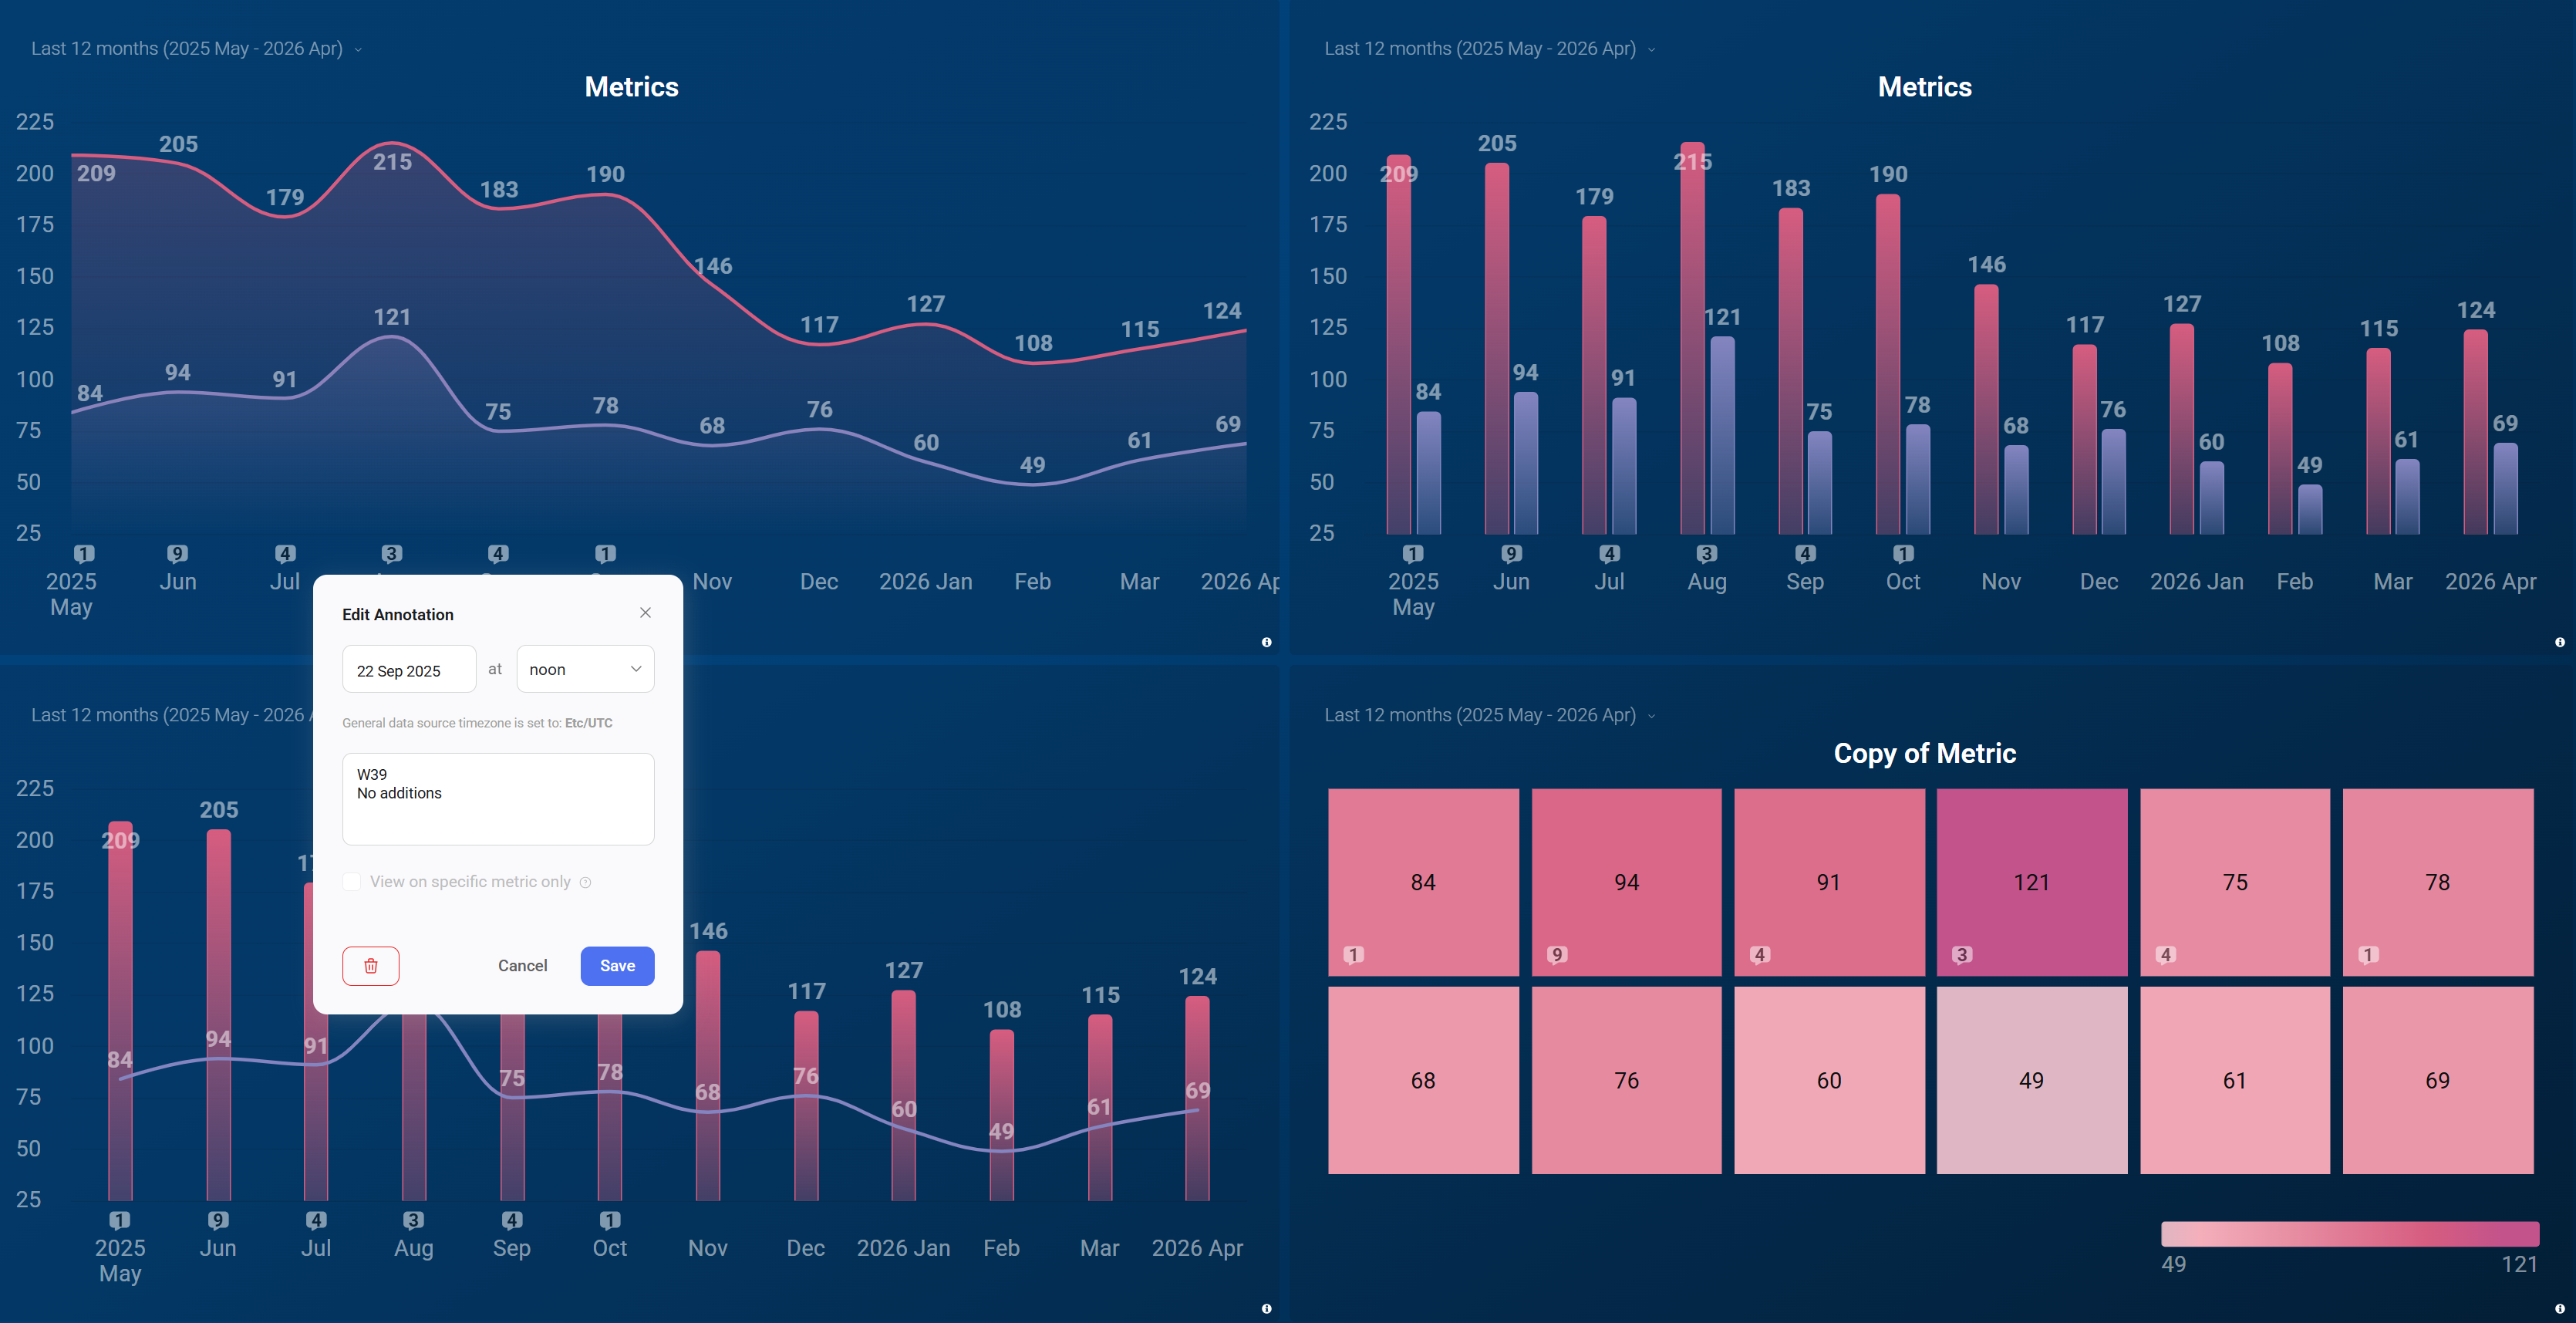
- Click Edit in the popup.
- Update the description or any other fields.
- Click Save.
- Click the annotation marker on the chart to open the annotation popup.
- Click the trash icon to delete the annotation.
FAQ
What happens to annotations if I change the chart's granularity?
Annotations are saved at the exact date and time you specify. As granularity decreases (for example, from daily to monthly), annotations that fall within the same period are grouped together under a single marker with a higher count.
Will an annotation appear on other charts if I don't check 'View on specific metric only'?
Yes. When unchecked, the annotation is applied globally and appears on all supported charts across your account at that point in time, regardless of data source or metric. Check the box to restrict it to the one specific metric it was added to.


