
Availability
Salesforce is a cloud-based customer relationship management platform that helps teams manage leads, accounts, opportunities, and customer interactions in a single system. It supports sales forecasting, workflow automation, and detailed reporting, giving organizations clear visibility into performance and helping them streamline processes. With its flexible data model and robust API, Salesforce makes it easy to access and analyze the information you rely on to drive growth.
If your credentials don't include full access to the data source, make sure your access level meets any permission requirements listed in the Specification section of the integration's page in the Metric Library.
- In Lightning Experience,click the gear icon in the top right and select Setup.
- In the left sidebar, go to Platform Tools > Apps > App Manager.
- Click New External Client App in the top right of the App Manager page.
- Complete the Basic Information section**.** These details are specific to your organization.
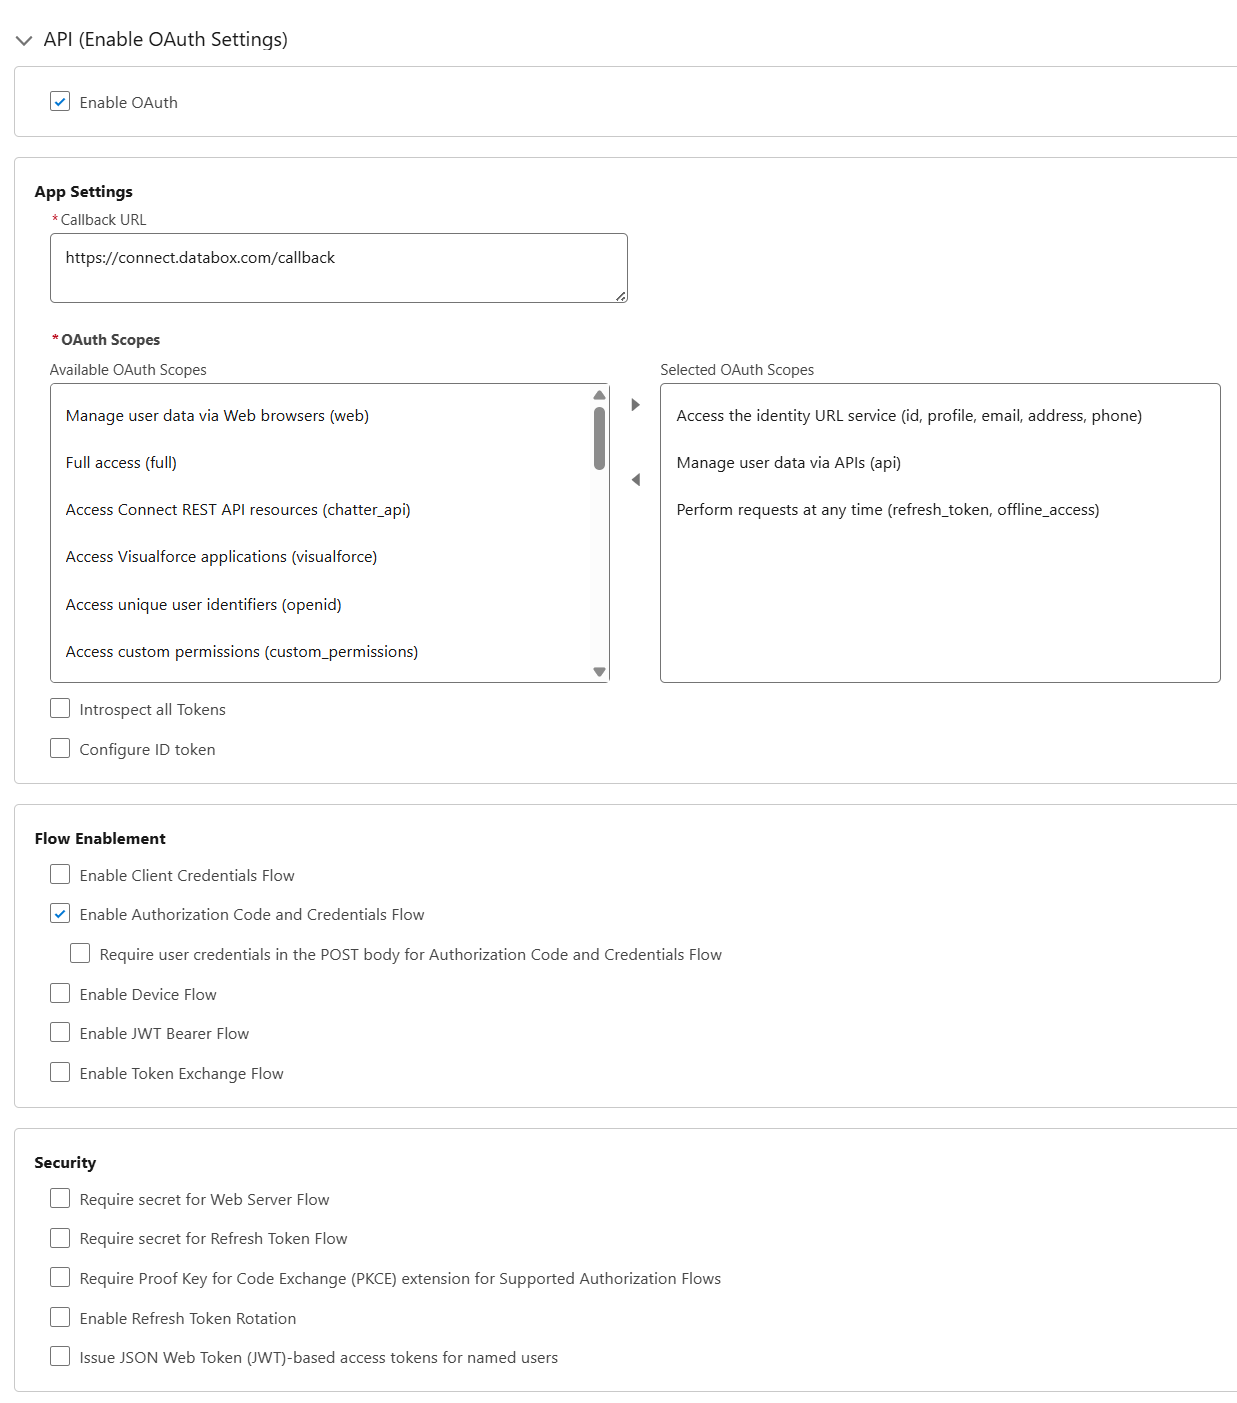
- Scroll to the API (Enable OAuth Settings) section.
- Select Enable OAuth.
- Configure the App Settings section:
- Callback URL:
https://connect.databox.com/callback - OAuth Scopes: Select each scope and move it to the right using the arrow:
Access the identity URL service (id, profile, email, address, phone)Manage user data via APIs (api)Perform requests at any time (refresh_token, offline_access)
- Callback URL:
- Scroll to the Flow Enablement section and select Enable Authorization Code and Credentials Flow.
- Scroll to the Security section and clear all security options.
- Click Create at the bottom.

When the app is created, its detail page opens automatically.
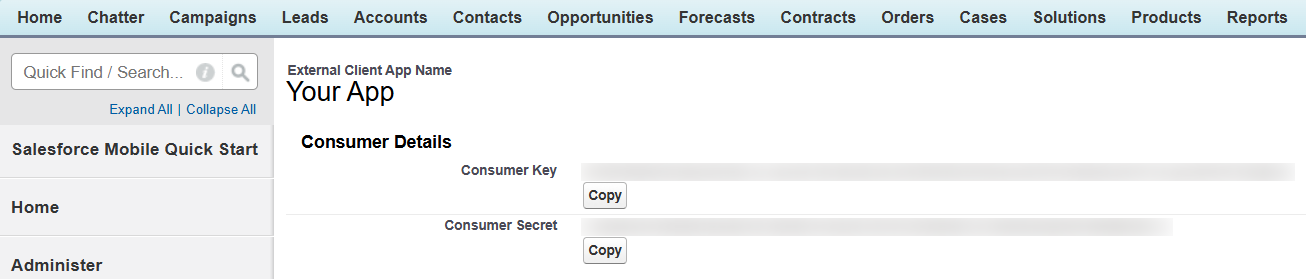
- Go to the Settings tab and open OAuth Settings.
- Scroll to the App Settings section.
- Click the button to view the Consumer Key and Consumer Secret. Salesforce may ask you to verify your identity with a security code.
- Save the Consumer Key and Consumer Secret. You will enter them in Databox in the following step.
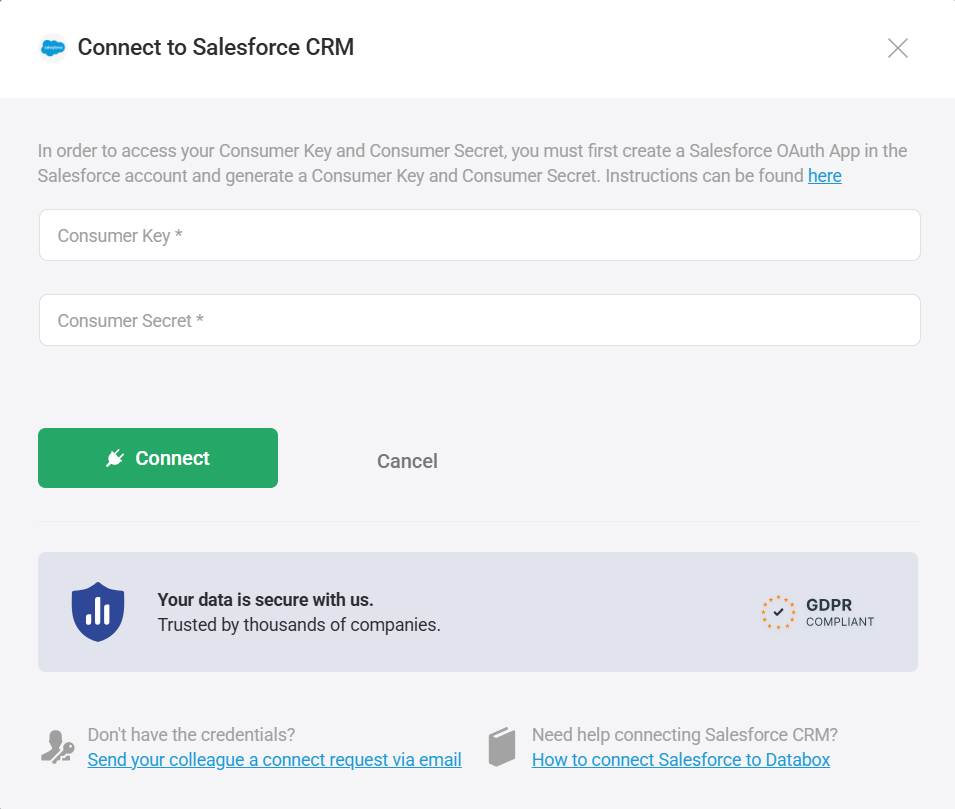
- Start the connection process in Databox.
- Enter the Consumer Key and Consumer Secret you saved in Step 2.
- Click Connect to continue.
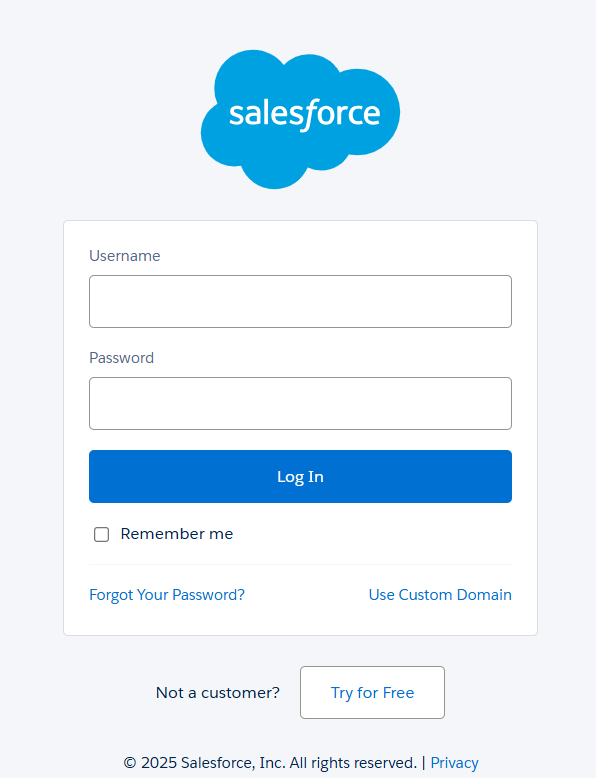
- Sign in with your Salesforce user credentials when prompted. Salesforce may ask you to verify your identity with a security code.
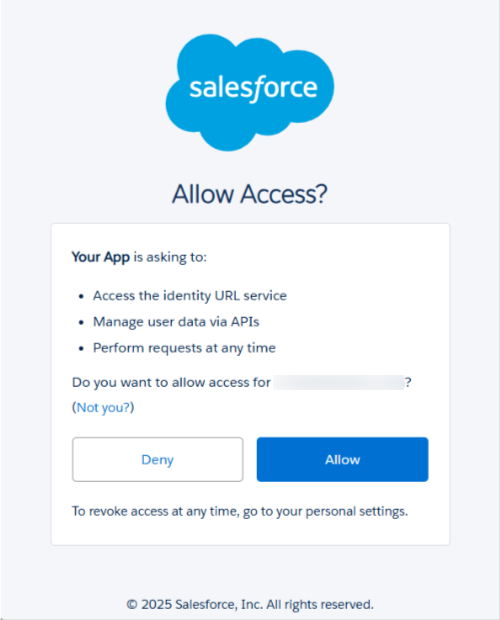
- Click Allow to authorize the connection.
The Salesforce CRM integration allows you to create custom metrics using the metric builder, ideal for visualizing data not included in the basic metrics offered by the integration.
To create a custom metric, start by selecting a metric from the "Metric" selector. Next, customize your metric by optionally adding a dimension and applying one or more filters.
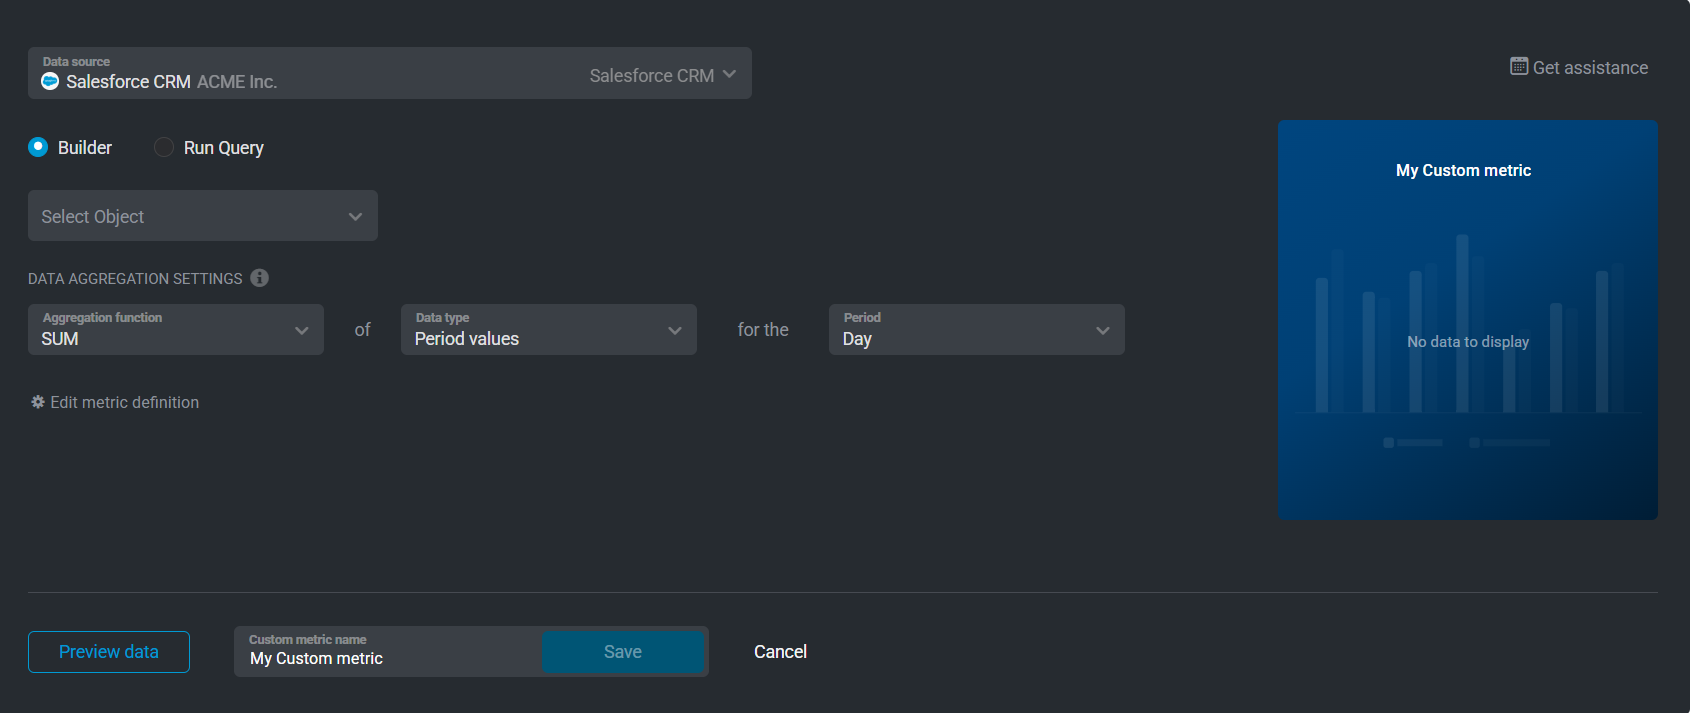
There are two ways to create custom metrics from your Salesforce data: Builder and Run Query.
Use Builder to create metrics without writing SOQL.
- Select the object you want to use.
- Choose a date field to define how data is grouped over time.
- Pick the metric field and metric operation (for example, COUNT, SUM, AVG).
- (Optional) Add one or more dimensions to break down the results.
A SOQL query is automatically generated based on your selections and runs at every sync.
Use Run Query to write your own SOQL if you need more control. This option is ideal when:
- You need advanced filtering or logic not supported in Builder.
- You want to join related objects.
- You require grouped or aggregated results beyond standard field operations.
Paste or write your custom SOQL query, and Databox will run it at every sync.
The Salesforce CRM integration supports the creation of datasets, which allow you to structure and format your Salesforce CRM data for more flexible reporting in Databox. By organizing your data into a tabular format, datasets make it easier to filter, segment, and visualize key metrics across projects, clients, and team members.
- Select a view: Choose the Salesforce object or table that contains the data you want to work with.
- Select columns: Browse and select the specific columns (fields) from your tables or views to include in your dataset. These columns define the structure and content of your dataset.
- Salesforce Objects Reference — Official Salesforce documentation listing all standard objects available in Salesforce.
- Salesforce API Field Properties — Documentation explaining how field properties affect query behavior, such as whether a field can be filtered, grouped, sorted, or used in aggregate queries.
For comprehensive details on metrics, data availability, templates, specifications, usage guidelines, and other key information, refer to the resources listed below.


FAQ
Can I use custom objects in Databox?
Yes. Databox supports both standard and custom objects. Any custom object that is accessible to your Salesforce user can be queried and used to build metrics.
Which Salesforce editions include API access?
API availability depends on your Salesforce edition and user license. To confirm whether your plan includes API access, review Salesforce's official guidance:
If your edition or license does not include API access, you may need to upgrade or adjust user permissions before connecting.


