Date ranges specify the time period for which data will be extracted, aggregated, and presented to you. It allows you to focus your analysis on relevant timeframes and compare data across different periods. In Databox, date ranges are configurable through predefined options and custom selections, facilitating tailored reporting based on the temporal context of the data.
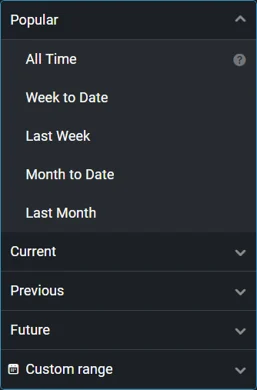
The date range selector in Databox is standardized across the application, offering a variety of options categorized into five groups, as outlined below.
- Week-based: Week to Date, Last Week
- Month-based: Month to Date, Last Month
- All Time
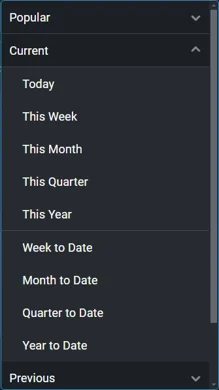
These date ranges include the current day and time, allowing you to analyze ongoing periods. Available options include:
- Today
- This
<period>(e.g., This Week, This Month) <period>to Date (e.g., Year to Date)
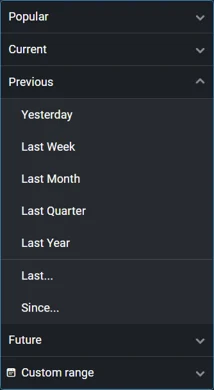
These date ranges focus on past periods and do not include the current day unless explicitly specified. You can customize "Last..." and "Since..." date ranges to include or exclude the current period. Examples include:
- Yesterday
- Last
<period>(e.g., Last Week, Last Month) - Last
<X> <period>(e.g., Last 7 Days) - Since
<date>(e.g., Since 5 July 2024) New!
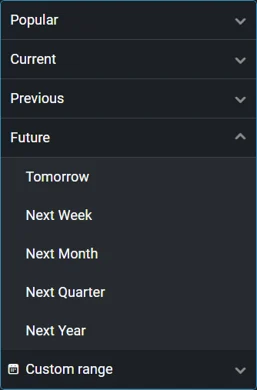
These date ranges begin in the future, helping you to plan and forecast. Examples include:
- Tomorrow
- Next
<period>(e.g., Next Week, Next Month)
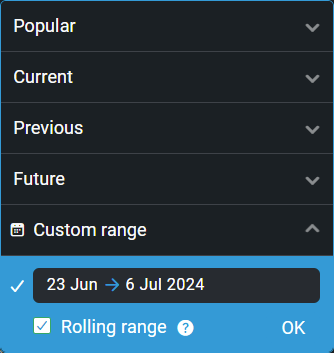
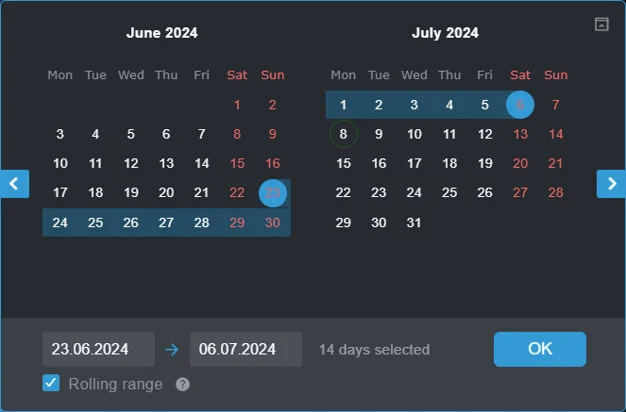
Custom date ranges allow you to set any fixed or rolling period between two days of your choice. Rolling periods automatically adjust start and end dates relative to the current date. For example:
- On July 5th, a custom date range is set from June 7 to June 13.
- On July 6th, the date range will automatically adjust to display data from June 8 to June 14.
The table below details the start and end dates for each date range option, including any available customization settings. Dates and times are based on the time zone specified in the data source settings.
| Date Range | Start Date* | End Date* |
|---|---|---|
| Today | 12:00 am of today | ☐ Include future: start of next hour ☑ Include future: 12:00 am of tomorrow |
This <period> | 12:00 am of the first day | 12:00 am of the day after last |
<period> to Date | 12:00 am of the first day | Start of next hour |
| Yesterday | 12:00 am of yesterday | 12:00 am of today |
Last <period> | 12:00 am of the first day | ☐ Include <period>: 12:00 am of the day after last of the previous period ☑ Include <period>: 12:00 am of the first day in the next period |
Since <date> | 12:00 am of the chosen date | ☐ Include today: 12:00 am of today ☑ Include today: 12:00 am of tomorrow |
| Tomorrow | 12:00 am of tomorrow | 12:00 am of the day after tomorrow |
Next <period> | 12:00 am of the first day | 12:00 am of the day after last |
| Custom | 12:00 am of the first day | 12:00 am of the day after last |
| All Time** | 12:00 am of the first day 10 years ago | 12:00 am of tomorrow 2 years into the future |
| All Time | 12:00 am of the first day 3 years ago | Start of next hour |
* Start dates are inclusive and end dates are exclusive, i.e. Start Date ≤ Date Range < End Date.
** Databases, spreadsheets, automations, and data sent via our REST API.
FAQ
Is it possible to adjust the date ranges to match my company's fiscal calendar?
Yes, Databox supports fiscal calendars with customizable year start and end dates, quarter start and end dates, and week-aligned calendars. For more information on how to enable this feature, please refer to our pricing page.
Why am I not able to see historical data for a metric?
Every metric in our system is optimized to retrieve data according to the source integration's technical specifications. Certain parameters, such as historical data availability, may be limited by the source and are beyond our control. For detailed information on specific integrations and metric implementations, please refer to the Metric Library.
Why can't I select certain date ranges?
The availability of date ranges depends on your subscription plan. If you select a date range that includes periods outside the historical data available in your plan, it will be automatically disabled.
Why is the weekly data in Databox not accurate despite having the first day of the week properly set in my account?
Some integrations only provide data grouped or aggregated in predetermined weekly periods, e.g. as starting on Monday and ending on Sunday. In such cases, it is not possible to break down this data into granular values and recalculate it according to new criteria.


