
The Designer gives you the ability to customize your Databoards and the data that is populating them. In this document, we will take a closer look at the Designer and the individual components that make it up.
Navigate to the Databoards page. Click on the green + New Databoard button in the top right. Select Start blank to create a new, blank Databoard in the Designer.
Navigate to the Databoards page. Hover over the Databoard that you want to edit and click Edit. This will open the Databoard in the Designer.
Color: From the Color drop-down, you can choose from 18 pre-defined Databoard background colors for your Databoard. At the bottom of the drop-down, you can also select a Chart Theme for the Databoard.
- Chart Themes are the colors that will be displayed for lines on Line Charts, bars on Bar Charts, slices in a Pie Chart, etc. Chart Theme options are dependent on the background color that is selected for your Databoard.
Visual: From the Advanced Visual Settings window, you can further brand your Databoard by uploading a logo for the bottom right-hand corner or a background image.
Copy URL: Open the Share Databoard window and access the Shareable Link, Schedule Snapshots of the Databoard, get the HTML code for the Databoard, so you can embed the live Databoard on a website, set the Stream to TV feature, or invite teammates to Databox.
Full-screen view: View the Databoard on a full-screen.
Send: Open the Send to Email window to send the Databoard as an email. Specify the Email recipient(s), File Format, and Date Range for the Databoard. If desired, add a custom subject and a personal note to the message as well.
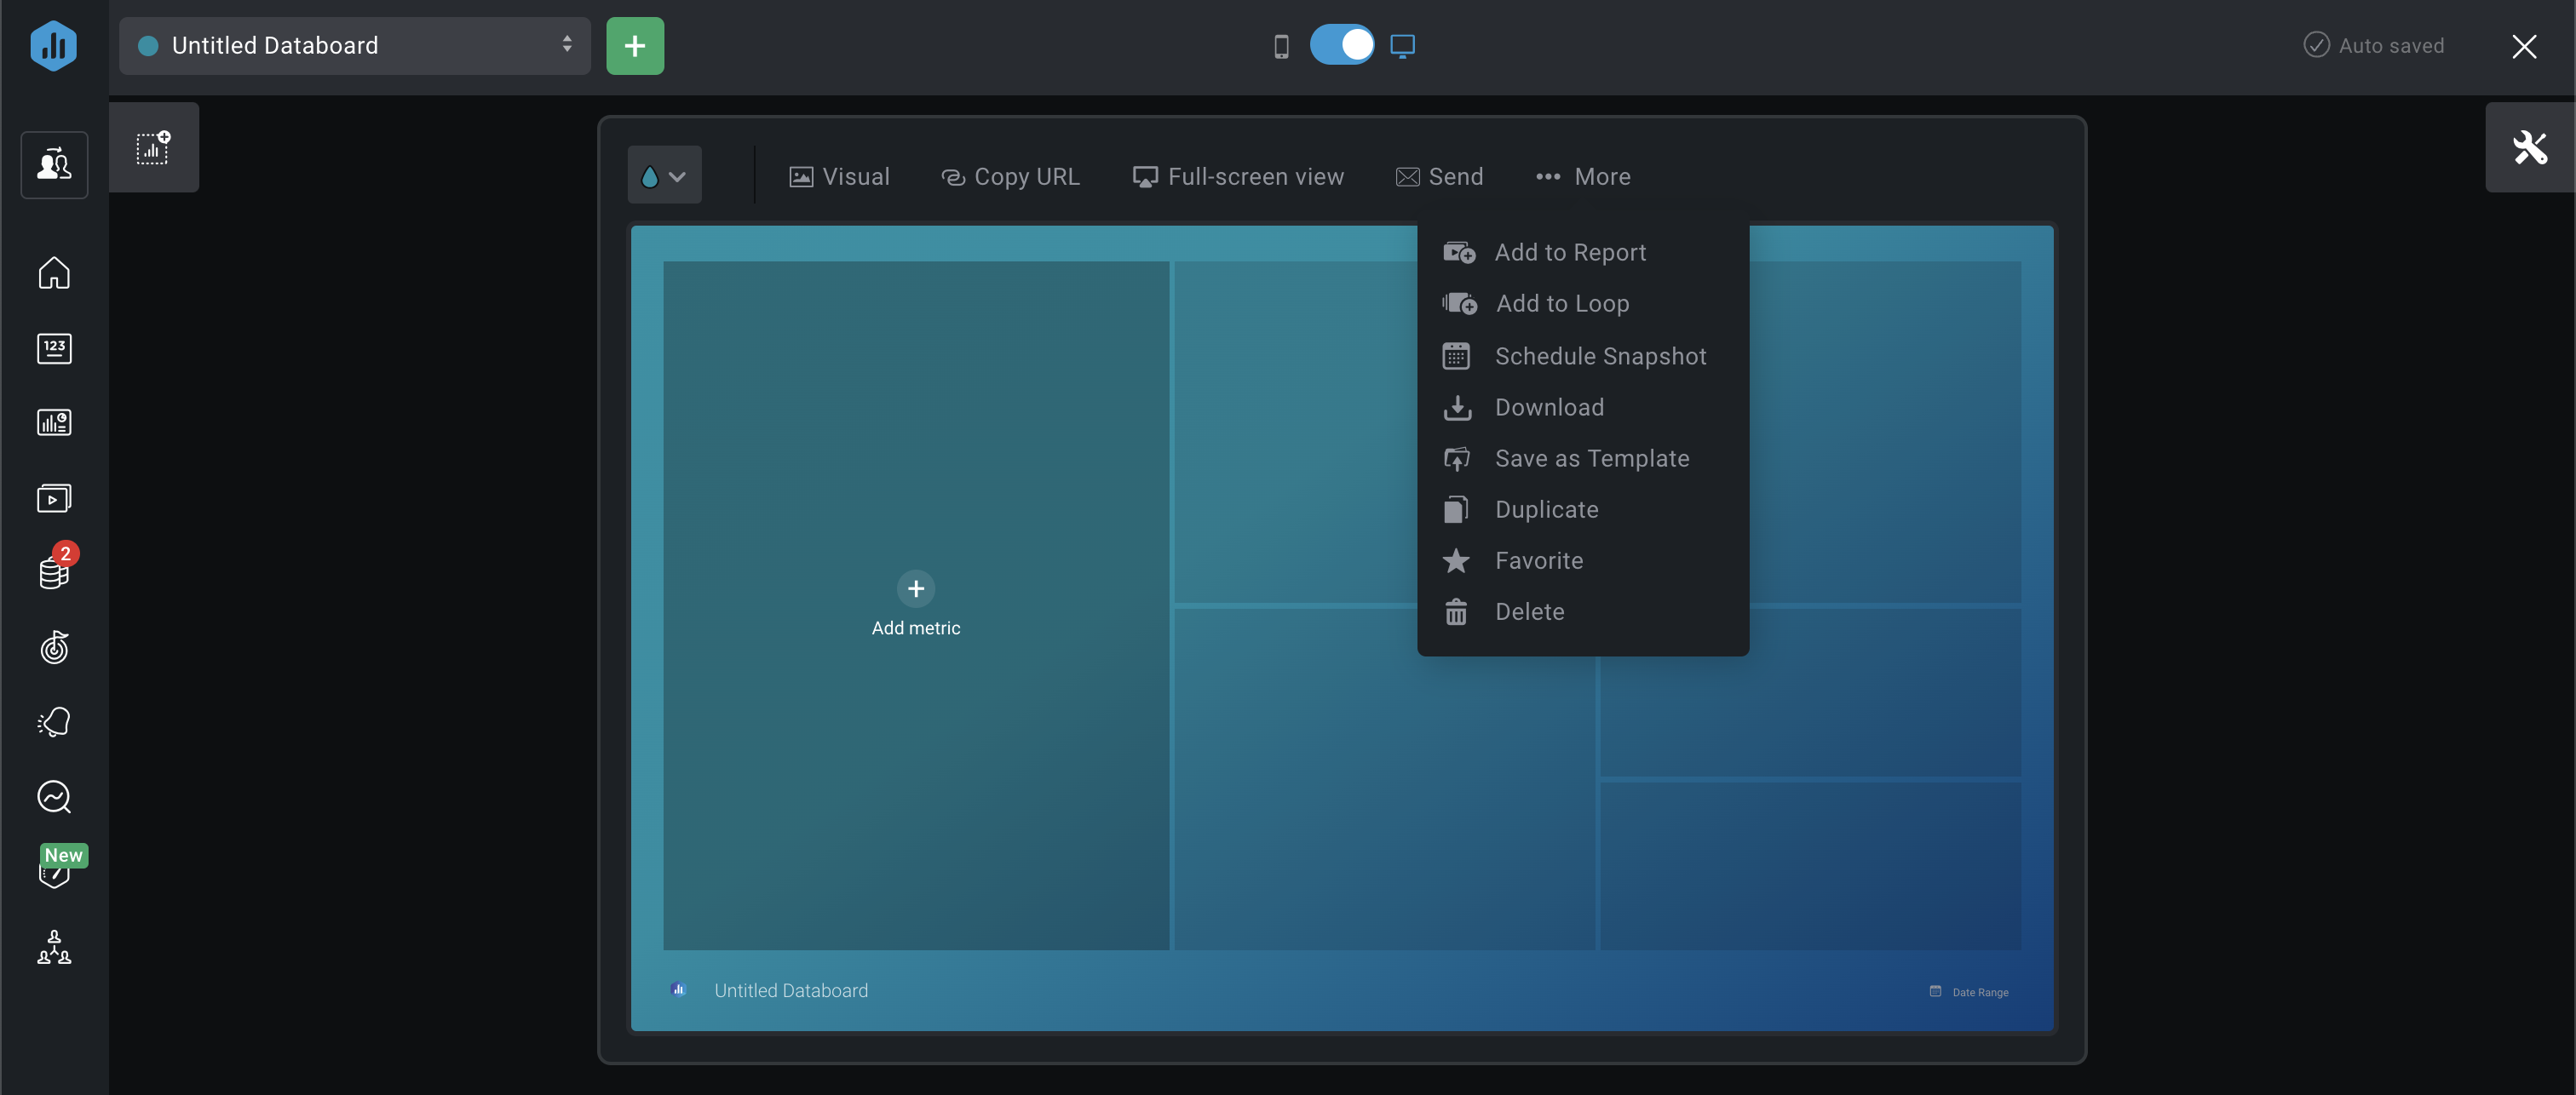
More: From the More drop-down you can select further features for your Databoard.
Add to Report: Add the Databoard to your Reports. From the drop-down, you can choose an existing Report you want to add the Databoard to, or you can create a new Report.
Add to Loop: Loop the Databoard to group multiple dashboards together. From the drop-down, you can choose an existing Loop you want to add the Databoard to, or you can create a new Loop.
Schedule Snapshot: With the Scheduled Snapshot, you can export a PDF or JPG of your Databox Databoard at regular times. Learn more about Scheduled Snapshots here.
Download: Download the JPG file of your Databoard
Save as Template: Save your Databoard as an Account Template so it's easily available for future use.
Duplicate: Duplicate your Databoard to simplify creating a new, similar Databoard.
Favorite: Mark your Databoard as Favorite. You can view all your Favorite Databaords on the Databoard page
Delete: This will Delete your Databoard
As you edit your Databoard, all changes will automatically be saved. While the Databoard is saving, it will say Saving in the top right. Once the Databoard is saved, it will say Saved in the top right.
If you want to start with a blank Datablock, you either drag and drop or click a blank Visualization Type to add it to your Databoard. You can then update the Datablock Editor to map this Datablock to a specific Data Source and Metric, select the most significant Date Range, change the comparison period, and more.
- Navigate to the Datablock Library on the left-hand side of the Designer to find the Visualization Type section.
- Find the visualization you want to add to your Databoard. Click on the Visualization or drag and drop the selected visualization from the Visualization Library to your Databoard. This will automatically produce a blank Datablock on your Databoard.
- Click on the Datablock to open the Datablock Editor on the right-hand side of the Designer. From here, you can select the Data source, Metric, Date Range, and additional customization options for the Datablock.
- To add another Datablock to the Databoard, navigate back to Visualization Types and choose the next visualization that you want to add to your Databoard.
Click on the Visualization or drag and drop the selected Datablock to your Databoard. Customize the Datablock using the Datablock Editor on the right-hand side.
Repeat this process for the remaining Datablocks you want to add to your Databoard.
The Metric Library consists of over 3,000 pre-built Datablocks based on commonly used Metrics and Visualization Types to help you build new Databoards faster
- Navigate to the Datablock Library on the left-hand side of the Designer to find the Metric Library section.
- Choose the Data Source you want to add to the Databoard from the Data Source drop-down list.
- Search for a pre-built Datablock that reports on the data you're looking for, using the Search bar if necessary.
- Navigate between Favorite Basic, Custom and Calculated Metrics by clicking on the Show drop-down.
- Pro Tip: All Metrics that you have added to your My Metrics screen will be accessible in the Metric Library as Favorite Metrics.
- Click on the green + button to add the Datablock to your Databoard. Another way to add the Datablock is to drag and drop the selected Datablock onto your Databoard. This will automatically populate with data from your selected Data Source. It will also populate with a Datablock Title, Visualization type, Date Range, etc. based on the most popular use cases.
- Pro Tip: Once the Datablock is on your Databoard, you can use theDatablock Editor to customize the Datablock to meet your specific needs.
- To add another Datablock to the Databoard, navigate back to the Metric Library and choose the next Datablock that you want to add to your Databoard.
- Pro Tip: Each Datablock is completely unique from all other Datablocks on the Databoard.
- Click on the green + button or drag and drop the selected Datablock to your Databoard
- Repeat this process for the remaining Datablocks you want to add to your Databoard.
- In the Designer, click on the Datablock that you want to move
- At the bottom of the Datablock, click on the Move Block icon
- Drag your cursor to move the Datablock
- In the Designer, click on the Datablock that you want to resize
- Place your cursor along the edge of the Datablock, which is now outlined in blue. This will turn your cursor into an arrow
- Click the edge of the Datablock and drag your cursor to resize the Datablock

- In the Designer, click on the Datablock that you want to duplicate
- At the bottom of the Datablock, click on the Duplicate Block icon
- On the Duplicate Datablock window, select the Databoard where you would like to duplicate the Datablock to. This can be a new Databoard, the Databoard the Datablock is already on, or another Databoard in your Account
- Click the green Duplicate button
- In the Designer, click on the Datablock that you want to delete
- At the bottom of the Datablock, click on the Remove Block icon
- Click Yes, Delete on the confirmation window to remove the Datablock from your Databoard
Learn how to customize your Datablock using Datablock Editor here.